The purpose of this post is to guide you on how to set up syslogging on a Cisco ASA firewall so you can ship your logs to a centralized log server like the ELK stack (Elasticsearch, Logstash and Kibana). This configuration guide is done using the ASDM (GUI).
Here is an example of what a Cisco syslog looks like…
%ASA-4-106023: Deny tcp src outside:109.230.217.95/24069 dst inside:164.32.112.125/25 by access-group "PERMIT_IN" [0x0, 0x0]"
The Cisco message above shows that the IP of 109.230.217.95 was denied access to a blocked SMTP port based on the access group “PERMIT_IN” for the public IP address of 164.32.112.125.
Here are the settings to tell our Firewall to send syslogs to our centralized log service. Open up your ASDM and log into your firewall.
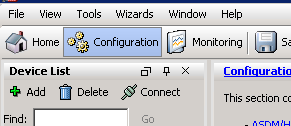
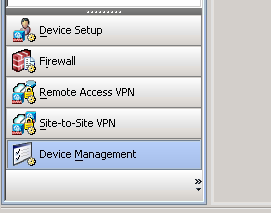
Click the configuration button on the top
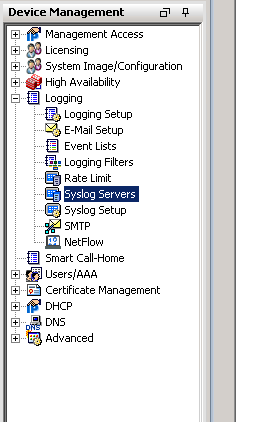
Expand “Logging” and click “Syslog Servers”
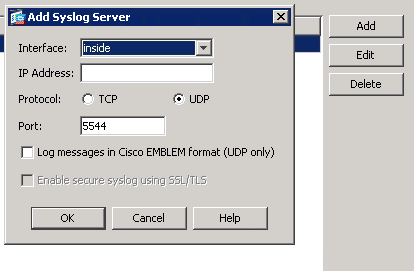
On the right side click “Add”, choose the inside interface, type in the IP of the machine you want to ship logs to, select UDP, type in your port and click OK.
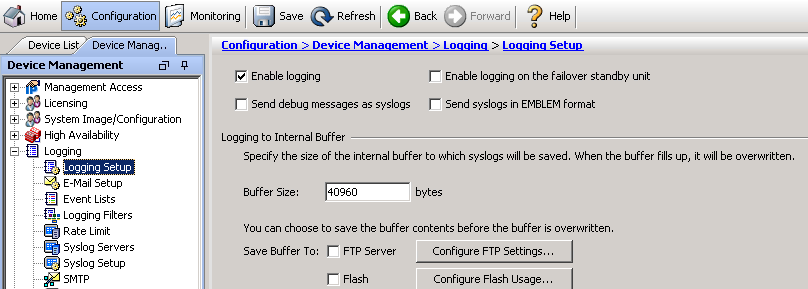
Click “Logging Setup”, select “Enable logging” and click apply.
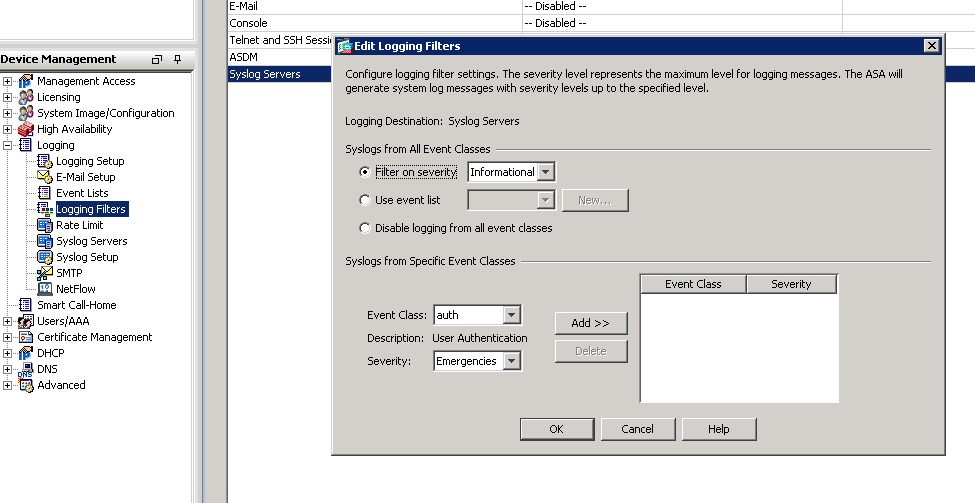
Click “Logging Filters”, double click “Syslog Servers”, check “Filter on severity”, select the type of logs you want to receive and click OK.
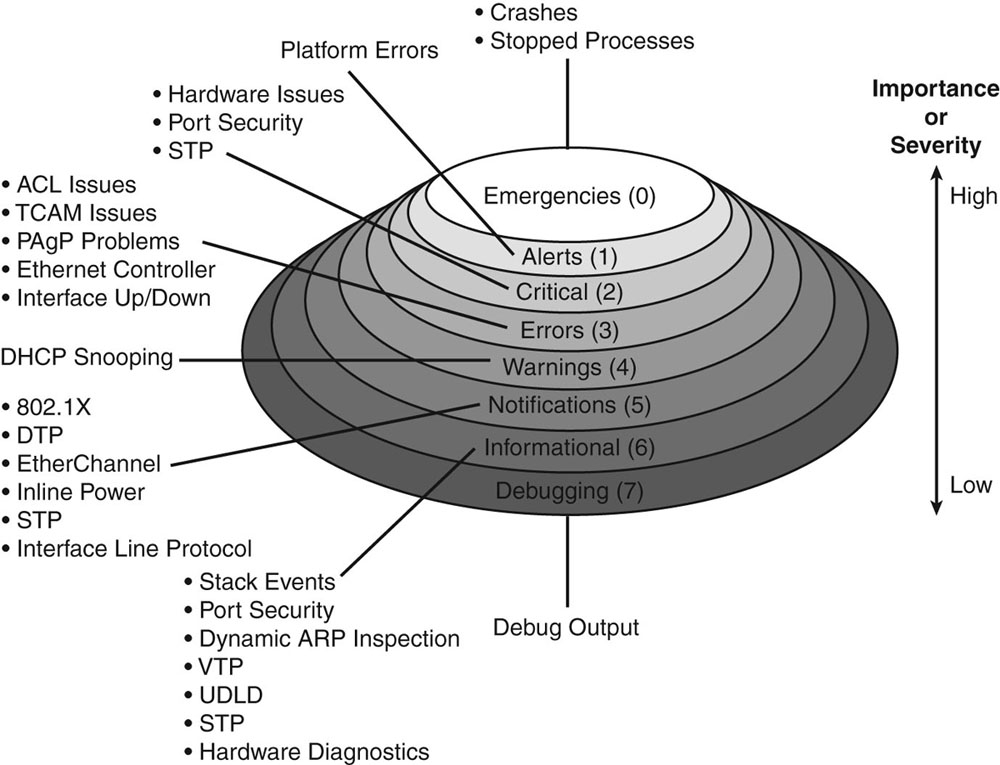
Here is an explanation of the different logging levels with Cisco products.
Now just save your running config to the startup config and you will now start seeing your logs on your centralized log server.
Awesome work Jack! I got it all going but the GeoIP dots on the map. I’m still working on that 🙂
Any pointers on that portion?
Spoke too Spoke too soon, I’m starting to see some now!
I got it going on a Ubuntu 14. server hyper-v vm. (4-proc’s 64G Ram)
I am making a smaller VM to cluster and do some of the work.
I’m using a 5520 with 9.1.5 code following your settings.
I had to struggle with rights issues & file paths for elasticsearch for some reason. It could be my extremely rusty linux skills…but seems to be working with LS 1.4.3 and ES 1.1.1 here.
I did add a patteren for 304001 to the firewalls patteren file.
I think I used:
# ASA-5-304001
CISCOFW304001 %{IP:src_IP} %{DATA:src_interface} %{WORD:protocol} %{IP:dst_ip} %{GREEDYDATA:interface}
Just so I got the source and destination IP… But I think there must be a much better way to match it.
It looks like my VPN Group Policy isn’t matching up right either ASA-4-722051. Is it fine just to let these pass-through UN-matched? or should I make patterns for things that are not matching?
Last question, I copied the firewalls pattern but it seems I should be making a file with just the additions I make somehow, how do you handle that?
Thanks a bunch!
James
Glad to see it is working out for you.
I have a couple messages that go through unmatched. I have been meaning to create my own custom patterns for those messages but I have just been so damn busy. The messages just show up as messages but with not as many fields and the tag “_grokparsefailure”.
For example, I also log my HSL messages from our F5 load balancer…
I created the file “F5.txt” inside the patterns dir. The text file looks like this…
F5_TEST_LOG ^\<190>\|%{F5_VIRTSERVER:virt}:%{NUMBER:virtPort:int}\|%{IP:clientIP}:%{NUMBER:clientPort:int}\|%{F5_METHOD:httpmethod}\|'%{URIPATHPARAM:request}'\|HTTP/%{NUMBER:httpversion}\|'%{GREEDYDATA:useragent}'\|%{QS:referrer}\|%{F5_TIMESTAMP:request_timestamp}\|%{NUMBER:request_length:int}\|%{NUMBER:request_elapsed_time}\|%{F5_NODE:node}\|%{NUMBER:response:int}\|%{F5_TIMESTAMP:response_timestamp}\|%{NUMBER:response_length:int}\|%{SYSLOGPROG:contentType}|Now in my logstash config I add this to grok
grok {match => { "message" => "%{F5_TEST_LOG}" }
patterns_dir => "C:\syslog\patterns"
}
Now it can parse though the fields for the HSL syslog message. This is just an example but it would be fairly similar of what you would need to do for the specific ASA message type. Hope that helps.
Hi
We need to audit administrators’ login to cisco asa firewall(to monitor how many times the admin login to firewall in a month). Firewall is sending syslog level 6
(info) to syslog server which is including syslog id 605004 and 605005.
We’ve managed to extract the access log but the firewall log a lot of log for each single login attempt.
I would like to know how many lines the ASA log for each login and is there any tools/software to audit the login attempt? Thank you….
34588: 3/3/2015 14:05:04 Local7.Info 10.27.1.1 %ASA-6-605005: Login permitted from 10.27.108.4/55791 to
MGMT:10.27.1.12/https for user “admin”
37192: 3/3/2015 14:05:27 Local7.Info 10.27.1.1 %ASA-6-605005: Login permitted from 10.27.108.4/55792 to
MGMT:10.27.1.12/https for user “admin”
38441: 3/3/2015 14:05:36 Local7.Info 10.27.1.1 %ASA-6-605005: Login permitted from 10.27.108.4/55793 to
MGMT:10.27.1.12/https for user “admin”
39639: 3/3/2015 14:05:45 Local7.Info 10.27.1.1 %ASA-6-605005: Login permitted from 10.27.108.4/55794 to
MGMT:10.27.1.12/https for user “admin”
41364: 3/3/2015 14:06:02 Local7.Info 10.27.1.1 %ASA-6-605005: Login permitted from 10.27.108.4/55795 to
MGMT:10.27.1.12/https for user “admin”
42527: 3/3/2015 14:06:16 Local7.Info 10.27.1.1 %ASA-6-605005: Login permitted from 10.27.108.4/55796 to
MGMT:10.27.1.12/https for user “admin”
43654: 3/3/2015 14:06:33 Local7.Info 10.27.1.1 %ASA-6-605005: Login permitted from 10.27.108.4/55797 to
MGMT:10.27.1.12/https for user “admin”
44140: 3/3/2015 14:06:40 Local7.Info 10.27.1.1 %ASA-6-605005: Login permitted from 10.27.108.4/55798 to
MGMT:10.27.1.12/https for user “admin”
45132: 3/3/2015 14:06:51 Local7.Info 10.27.1.1 %ASA-6-605005: Login permitted from 10.27.108.4/55799 to
MGMT:10.27.1.12/https for user “admin”
46429: 3/3/2015 14:07:05 Local7.Info 10.27.1.1 %ASA-6-605005: Login permitted from 10.27.108.4/55800 to
MGMT:10.27.1.12/https for user “admin”
47072: 3/3/2015 14:07:10 Local7.Info 10.27.1.1 %ASA-6-605005: Login permitted from 10.27.108.4/55801 to
MGMT:10.27.1.12/https for user “admin”
48745: 3/3/2015 14:07:28 Local7.Info 10.27.1.1 %ASA-6-605005: Login permitted from 10.27.108.4/55802 to
MGMT:10.27.1.12/https for user “admin”
49666: 3/3/2015 14:07:39 Local7.Info 10.27.1.1 %ASA-6-605005: Login permitted from 10.27.108.4/55803 to
MGMT:10.27.1.12/https for user “admin”
51012: 3/3/2015 14:07:48 Local7.Info 10.27.1.1 %ASA-6-605005: Login permitted from 10.27.108.4/55804 to
MGMT:10.27.1.12/https for user “admin”
53178: 3/3/2015 14:08:03 Local7.Info 10.27.1.1 %ASA-6-605005: Login permitted from 10.27.108.4/55805 to
MGMT:10.27.1.12/https for user “admin”
55247: 3/3/2015 14:08:17 Local7.Info 10.27.1.1 %ASA-6-605005: Login permitted from 10.27.108.4/55806 to
MGMT:10.27.1.12/https for user “admin”
55931: 3/3/2015 14:08:22 Local7.Info 10.27.1.1 %ASA-6-605005: Login permitted from 10.27.108.4/55807 to
MGMT:10.27.1.12/https for user “admin”
57705: 3/3/2015 14:08:34 Local7.Info 10.27.1.1 %ASA-6-605005: Login permitted from 10.27.108.4/55808 to
MGMT:10.27.1.12/https for user “admin”
58013: 3/3/2015 14:08:36 Local7.Info 10.27.1.1 %ASA-6-605005: Login permitted from 10.27.108.4/55809 to
MGMT:10.27.1.12/https for user “admin”
58023: 3/3/2015 14:08:36 Local7.Info 10.27.1.1 %ASA-6-605005: Login permitted from 10.27.108.4/55810 to
MGMT:10.27.1.12/https for user “admin”
58356: 3/3/2015 14:08:39 Local7.Info 10.27.1.1 %ASA-6-605005: Login permitted from 10.27.108.4/55811 to
MGMT:10.27.1.12/https for user “admin”
58368: 3/3/2015 14:08:39 Local7.Info 10.27.1.1 %ASA-6-605005: Login permitted from 10.27.108.4/55812 to
MGMT:10.27.1.12/https for user “admin”
59747: 3/3/2015 14:08:54 Local7.Info 10.27.1.1 %ASA-6-605005: Login permitted from 10.27.108.4/55813 to
MGMT:10.27.1.12/https for user “admin”
Great blog post! Helped me a bunch. I am working with Kibana 4 dashboards now. Thanks for the help.