I originally wrote this as a comment on the Networking subreddit but I thought I would post this here in case anyone was curious on using open source tools for centralized logging.
Originally we were using Graylog2 for message analysis but I recently found out about Kibana and it is substantially better. What this guide will do is help to transform raw syslog messages from your Cisco ASA like this…
<182>Apr 21 2014 11:51:03: %ASA-6-302014: Teardown TCP connection 9443865 for outside:123.456.789.10/9058 to inside:10.20.30.40/443 duration 0:00:20 bytes 3925 TCP FINs\n
and filter them into this…
{
 "_index": "logstash-2014.04.21",
 "_type": "cisco-fw",
 "_id": "I7yBKbUITHWxuMrAhaoNWQ",
 "_source": {
 "message": "<182>Apr 21 2014 11:51:03: %ASA-6-302014: Teardown TCP connection 9443865 for outside:123.456.789.10/9058 to inside:10.20.30.40/443 duration 0:00:20 bytes 3925 TCP FINs\n",
 "@version": "1",
 "@timestamp": "2014-04-21T15:51:03.000Z",
 "type": "cisco-fw",
 "host": "10.20.30.1",
 "syslog_pri": "182",
 "timestamp": "Apr 21 2014 11:51:03",
 "ciscotag": "ASA-6-302014",
 "cisco_message": "Teardown TCP connection 9443865 for outside:123.456.789.10/9058 to inside:10.20.30.40/443 duration 0:00:20 bytes 3925 TCP FINs",
 "syslog_severity_code": 6,
 "syslog_facility_code": 22,
 "syslog_facility": "local6",
 "syslog_severity": "informational",
 "action": "Teardown",
 "protocol": "TCP",
 "connection_id": "9443865",
 "src_interface": "outside",
 "src_ip": "123.456.789.10",
 "src_port": "9058",
 "dst_interface": "inside",
 "dst_ip": "10.20.30.40",
 "dst_port": "443",
 "duration": "0:00:20",
 "bytes": "3925",
 "reason": "TCP FINs",
 "tags": [
 "GeoIP"
 ]
 },
 "sort": [
 "apr",
 1398095463000
 ]
}
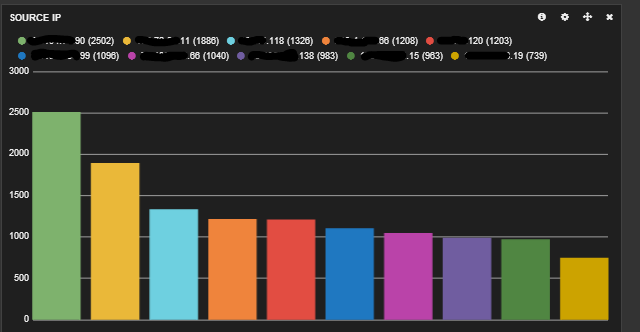
Using this newly created data, you can do things like see which IP is hitting your web servers the most, see which country is giving you the most traffic, see a graph of when your site is being accessed the most through out the day etc.
Here’s my setup
- Cisco ASA with syslog turned on
- Windows server running Logstash 1.40
- Ubuntu 12.04 running Elasticsearch and Kibana
All three of these programs can be run on the same machine and also can be run on either OS (logstash & elasticsearch are java based and kibana is just html/js/css so all you need is apache) but my setup (and this guide) is what is listed above.
Download GeoIP database
First thing I did was download a IP – Lat/long database here. This flat file database will be used by logstash to get the location of the IP addresses hitting the firewall so you can map hits like this… 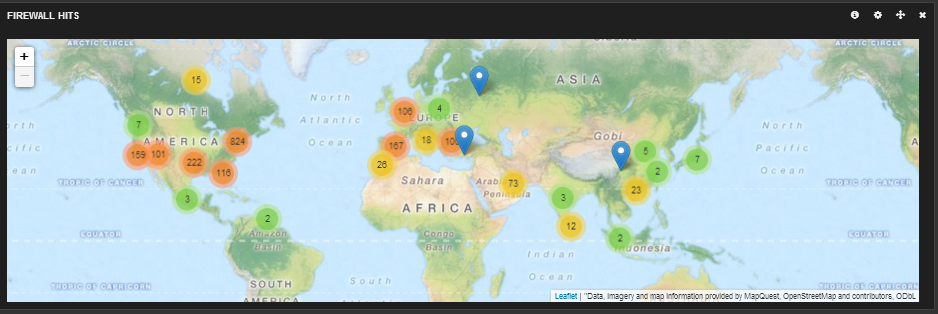
Unzip the file and remember where you put the GeoLiteCity.dat
Download Logstash
Next I downloaded the latest version of Logstash. Unzip and throw somewhere on your computer.
Download and Install Elasticsearch
Switch to you Ubuntu 12.04 LTS machine and open a terminal session (ctrl + alt + t) and enter these commands.
 cd ~
 sudo apt-get update
 sudo apt-get install openjdk-7-jre-headless -y
 wget https://download.elasticsearch.org/elasticsearch/elasticsearch/elasticsearch-1.3.1.deb
 sudo dpkg -i elasticsearch-1.3.1.deb
This will install java and Elasticsearch 1.3.1 on your machine.
Next you need to configure up elasticsearch on your machine.
sudo sed -i -e 's|# cluster.name: elasticsearch|cluster.name: kibana|' /etc/elasticsearch/elasticsearch.yml
Now you need to tell your machine to run elasticsearch on boot.
sudo update-rc.d elasticsearch defaults 95 10
sudo service elasticsearch restart
Installing Kibana
First you have to have Apache on your machine. There are plenty of guides on getting that set up if you are not familiar. Here is a good post about setting up Apache on Ubuntu. http://aarvik.dk/initial-web-server-setup-with-apache-mod_rewrite-and-virtual-host/
Next, download Kibana here.
- Extract your archive
- Open config.js in an editor
- Set the elasticsearch parameter to the fully qualified hostname of your Elasticsearch server
- Copy the contents of the extracted directory to your webserver
- Open your browser to kibana. (ex: http://127.0.0.1/kibana3)
Logstash Configuration
(Switch back to your Windows machine)
Next I created the logstash config file (logstash needs to know how to filter the syslog messages for parsing). Here is my config file…
input {
 udp {
 port => 5544 ## change me to whatever you set your ASA syslog port to
 type => "cisco-fw"
 }
}

filter {
 ####### Cisco FW ####
 if [type] == "cisco-fw" {
 grok {
 match => ["message", "%{CISCO_TAGGED_SYSLOG} %{GREEDYDATA:cisco_message}"]
 }
 # Parse the syslog severity and facility
 syslog_pri { }

 # Extract fields from the each of the detailed message types
 # The patterns provided below are included in core of LogStash 1.2.0.
 grok {
 match => [
 "cisco_message", "%{CISCOFW106001}",
 "cisco_message", "%{CISCOFW106006_106007_106010}",
 "cisco_message", "%{CISCOFW106014}",
 "cisco_message", "%{CISCOFW106015}",
 "cisco_message", "%{CISCOFW106021}",
 "cisco_message", "%{CISCOFW106023}",
 "cisco_message", "%{CISCOFW106100}",
 "cisco_message", "%{CISCOFW110002}",
 "cisco_message", "%{CISCOFW302010}",
 "cisco_message", "%{CISCOFW302013_302014_302015_302016}",
 "cisco_message", "%{CISCOFW302020_302021}",
 "cisco_message", "%{CISCOFW305011}",
 "cisco_message", "%{CISCOFW313001_313004_313008}",
 "cisco_message", "%{CISCOFW313005}",
 "cisco_message", "%{CISCOFW402117}",
 "cisco_message", "%{CISCOFW402119}",
 "cisco_message", "%{CISCOFW419001}",
 "cisco_message", "%{CISCOFW419002}",
 "cisco_message", "%{CISCOFW500004}",
 "cisco_message", "%{CISCOFW602303_602304}",
 "cisco_message", "%{CISCOFW710001_710002_710003_710005_710006}",
 "cisco_message", "%{CISCOFW713172}",
 "cisco_message", "%{CISCOFW733100}"
 ]
 }

 geoip {
 add_tag => [ "GeoIP" ]
 database => "C:\GeoLiteCity.dat" ### Change me to location of GeoLiteCity.dat file
 source => "src_ip"
 }

 if [geoip][city_name] == "" { mutate { remove_field => "[geoip][city_name]" } }
 if [geoip][continent_code] == "" { mutate { remove_field => "[geoip][continent_code]" } }
 if [geoip][country_code2] == "" { mutate { remove_field => "[geoip][country_code2]" } }
 if [geoip][country_code3] == "" { mutate { remove_field => "[geoip][country_code3]" } }
 if [geoip][country_name] == "" { mutate { remove_field => "[geoip][country_name]" } }
 if [geoip][latitude] == "" { mutate { remove_field => "[geoip][latitude]" } }
 if [geoip][longitude] == "" { mutate { remove_field => "[geoip][longitude]" } }
 if [geoip][postal_code] == "" { mutate { remove_field => "[geoip][postal_code]" } }
 if [geoip][region_name] == "" { mutate { remove_field => "[geoip][region_name]" } }
 if [geoip][time_zone] == "" { mutate { remove_field => "[geoip][time_zone]" } }


 # Parse the date
 date {
 match => ["timestamp",
 "MMM dd HH:mm:ss",
 "MMM d HH:mm:ss",
 "MMM dd yyyy HH:mm:ss",
 "MMM d yyyy HH:mm:ss"
 ]
 }
 }
 ###### End of Cisco FW #######
}

output {
 stdout {
 codec => json
 }

 elasticsearch_http {
 host => "10.0.0.123" # change me to the IP of your elasticsearch server
 }
}
Change the geoip location and elasticsearch IP address in your config file
geoip {
        add_tag => [ "GeoIP" ]
         database => "location of geolitecity.dat file. ex c:\geolitecity.dat"
and
elasticsearch_http {
        host => "IP of elasticsearch server"
Save the config file in your Logstash folder as config.conf.
Next run Logstash with your newly created config file.
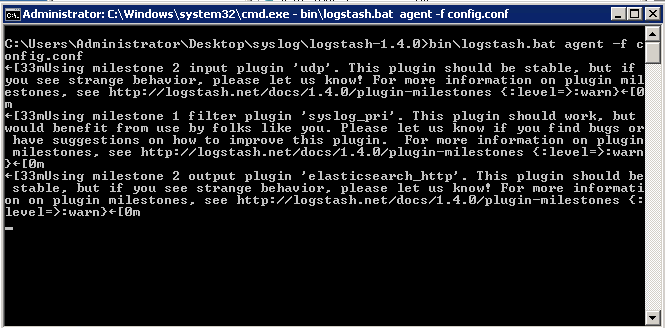
bin\logstash.bat agent -f config.conf
You might see warnings but you should not be seeing any errors
Cisco ASA configuration vis ASDM
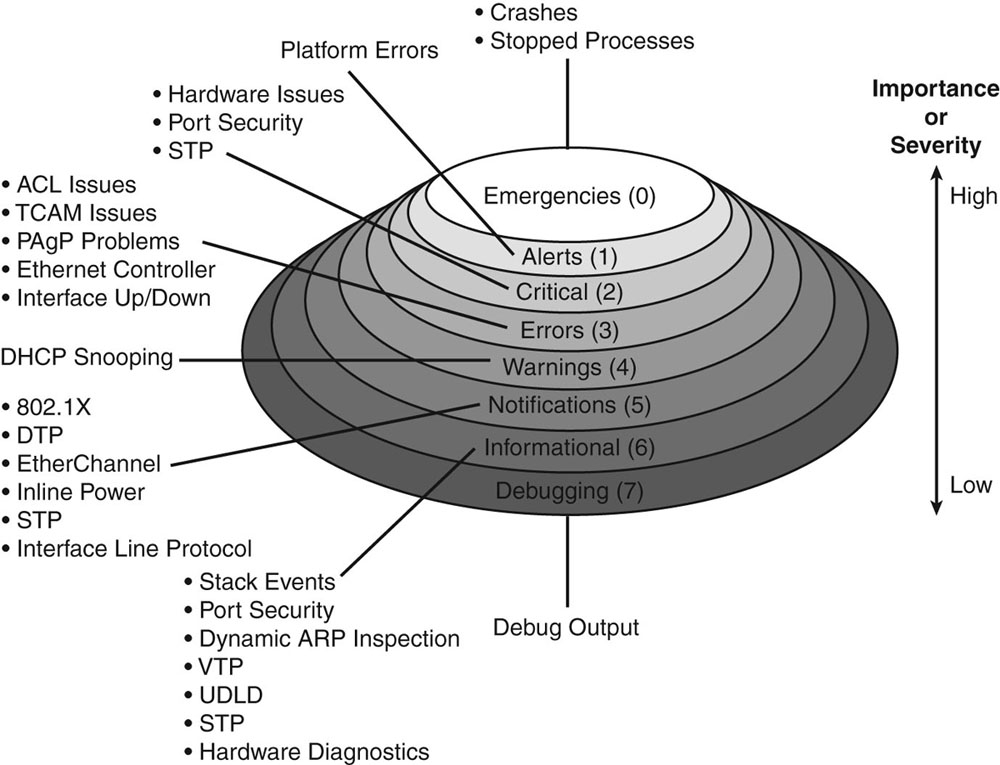
Follow my guide here to turn on syslogging on your ASA firewall. Set the IP to the IP address of the server running logstash and set the port to 5544 like in the logstash config file. I set my logging level to informational but you can set it to whatever level you want to log. Here is an explanation of the different logging levels with Cisco products.
As soon as you apply the config in the ASA, you should immediately start seeing results in your logstash window because one of the outputs was set to stdout.
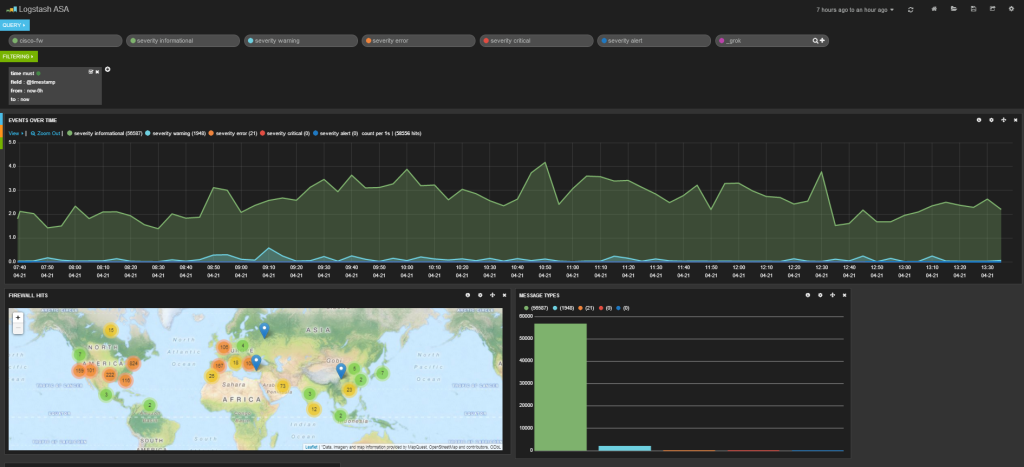
The messages are also going to your elasticsearch server. Open your browser to kibana and read the getting started guides. Once you configure your dashboard, you should start seeing results like this.
Here is my dashboard code in case you are curious. It shows a graph of message types, a map of hits, a graph of source and destination IPs, a histogram of messages per second and a list of the messages at the bottom.
To get this to work in Kibana…
1. Copy all of the code below
2. Save it as a text file
3. Go to Kibana
4. Click the Load icon at the top right of the page
5. Click Advanced
6. Click choose file and pick the file you just saved.
{
  "title": "Logstash ASA",
  "services": {
    "query": {
      "list": {
        "0": {
          "query": "cisco-fw",
          "alias": "",
          "color": "#7EB26D",
          "id": 0,
          "pin": false,
          "type": "lucene",
          "enable": true
        },
        "1": {
          "id": 1,
          "color": "#7EB26D",
          "alias": "",
          "pin": false,
          "type": "lucene",
          "enable": true,
          "query": "severity informational"
        },
        "2": {
          "id": 2,
          "color": "#6ED0E0",
          "alias": "",
          "pin": false,
          "type": "lucene",
          "enable": true,
          "query": "severity warning"
        },
        "3": {
          "id": 3,
          "color": "#EF843C",
          "alias": "",
          "pin": false,
          "type": "lucene",
          "enable": true,
          "query": "severity error"
        },
        "4": {
          "id": 4,
          "color": "#E24D42",
          "alias": "",
          "pin": false,
          "type": "lucene",
          "enable": true,
          "query": "severity critical"
        },
        "5": {
          "id": 5,
          "color": "#1F78C1",
          "alias": "",
          "pin": false,
          "type": "lucene",
          "enable": true,
          "query": "severity alert"
        },
        "6": {
          "id": 6,
          "color": "#BA43A9",
          "alias": "",
          "pin": false,
          "type": "lucene",
          "enable": true,
          "query": "_grok"
        }
      },
      "ids": [
        0,
        1,
        2,
        3,
        4,
        5,
        6
      ]
    },
    "filter": {
      "list": {
        "0": {
          "type": "time",
          "field": "@timestamp",
          "from": "now-6h",
          "to": "now",
          "mandate": "must",
          "active": true,
          "alias": "",
          "id": 0
        }
      },
      "ids": [
        0
      ]
    }
  },
  "rows": [
    {
      "title": "Graph",
      "height": "350px",
      "editable": true,
      "collapse": false,
      "collapsable": true,
      "panels": [
        {
          "span": 12,
          "editable": true,
          "group": [
            "default"
          ],
          "type": "histogram",
          "mode": "count",
          "time_field": "@timestamp",
          "value_field": null,
          "auto_int": true,
          "resolution": 100,
          "interval": "5m",
          "fill": 3,
          "linewidth": 3,
          "timezone": "browser",
          "spyable": true,
          "zoomlinks": true,
          "bars": false,
          "stack": false,
          "points": false,
          "lines": true,
          "legend": true,
          "x-axis": true,
          "y-axis": true,
          "percentage": false,
          "interactive": true,
          "queries": {
            "mode": "selected",
            "ids": [
              1,
              2,
              3,
              4,
              5
            ]
          },
          "title": "Events over time",
          "intervals": [
            "auto",
            "1s",
            "1m",
            "5m",
            "10m",
            "30m",
            "1h",
            "3h",
            "12h",
            "1d",
            "1w",
            "1M",
            "1y"
          ],
          "options": true,
          "tooltip": {
            "value_type": "cumulative",
            "query_as_alias": true
          },
          "scale": 1,
          "y_format": "none",
          "grid": {
            "max": null,
            "min": 0
          },
          "annotate": {
            "enable": false,
            "query": "*",
            "size": 20,
            "field": "_type",
            "sort": [
              "_score",
              "desc"
            ]
          },
          "pointradius": 5,
          "show_query": true,
          "legend_counts": true,
          "zerofill": true,
          "derivative": false,
          "scaleSeconds": true
        },
        {
          "error": false,
          "span": 6,
          "editable": true,
          "type": "bettermap",
          "loadingEditor": false,
          "field": "geoip.location",
          "size": 2000,
          "spyable": true,
          "tooltip": "_id",
          "queries": {
            "mode": "all",
            "ids": [
              0,
              1,
              2,
              3,
              4,
              5,
              6
            ]
          },
          "title": "Firewall Hits"
        },
        {
          "error": false,
          "span": 4,
          "editable": true,
          "type": "terms",
          "loadingEditor": false,
          "field": "syslog_severity",
          "exclude": [],
          "missing": true,
          "other": true,
          "size": 7,
          "order": "count",
          "style": {
            "font-size": "10pt"
          },
          "donut": false,
          "tilt": false,
          "labels": true,
          "arrangement": "horizontal",
          "chart": "bar",
          "counter_pos": "above",
          "spyable": true,
          "queries": {
            "mode": "all",
            "ids": [
              0,
              1,
              2,
              3,
              4,
              5,
              6
            ]
          },
          "tmode": "terms",
          "tstat": "total",
          "valuefield": "",
          "title": "Message Types"
        },
        {
          "error": false,
          "span": 4,
          "editable": true,
          "type": "terms",
          "loadingEditor": false,
          "field": "src_ip",
          "exclude": [],
          "missing": false,
          "other": false,
          "size": 10,
          "order": "count",
          "style": {
            "font-size": "10pt"
          },
          "donut": false,
          "tilt": false,
          "labels": true,
          "arrangement": "horizontal",
          "chart": "bar",
          "counter_pos": "above",
          "spyable": false,
          "queries": {
            "mode": "all",
            "ids": [
              0,
              1,
              2,
              3,
              4,
              5,
              6
            ]
          },
          "tmode": "terms",
          "tstat": "total",
          "valuefield": "",
          "title": "Source IP"
        },
        {
          "error": false,
          "span": 4,
          "editable": true,
          "type": "terms",
          "loadingEditor": false,
          "field": "dst_ip",
          "exclude": [],
          "missing": true,
          "other": true,
          "size": 10,
          "order": "count",
          "style": {
            "font-size": "10pt"
          },
          "donut": false,
          "tilt": false,
          "labels": true,
          "arrangement": "horizontal",
          "chart": "bar",
          "counter_pos": "above",
          "spyable": true,
          "queries": {
            "mode": "all",
            "ids": [
              0,
              1,
              2,
              3,
              4,
              5,
              6
            ]
          },
          "tmode": "terms",
          "tstat": "total",
          "valuefield": "",
          "title": "DESTINATION IP"
        }
      ],
      "notice": false
    },
    {
      "title": "Events",
      "height": "350px",
      "editable": true,
      "collapse": false,
      "collapsable": true,
      "panels": [
        {
          "title": "All events",
          "error": false,
          "span": 12,
          "editable": true,
          "group": [
            "default"
          ],
          "type": "table",
          "size": 100,
          "pages": 5,
          "offset": 0,
          "sort": [
            "timestamp",
            "desc"
          ],
          "style": {
            "font-size": "9pt"
          },
          "overflow": "min-height",
          "fields": [
            "duration",
            "cisco_message",
            "geoip.location",
            "direction",
            "src_ip",
            "dst_ip",
            "timestamp",
            "dst_port",
            "syslog_severity",
            "src_xlated_ip",
            "src_mapped_ip"
          ],
          "localTime": true,
          "timeField": "@timestamp",
          "highlight": [],
          "sortable": true,
          "header": true,
          "paging": true,
          "spyable": true,
          "queries": {
            "mode": "all",
            "ids": [
              0,
              1,
              2,
              3,
              4,
              5,
              6
            ]
          },
          "field_list": true,
          "status": "Stable",
          "trimFactor": 300,
          "normTimes": true,
          "all_fields": false
        }
      ],
      "notice": false
    }
  ],
  "editable": true,
  "failover": false,
  "index": {
    "interval": "day",
    "pattern": "[logstash-]YYYY.MM.DD",
    "default": "NO_TIME_FILTER_OR_INDEX_PATTERN_NOT_MATCHED",
    "warm_fields": true
  },
  "style": "dark",
  "panel_hints": true,
  "pulldowns": [
    {
      "type": "query",
      "collapse": false,
      "notice": false,
      "query": "*",
      "pinned": true,
      "history": [
        "_grok",
        "severity alert",
        "severity critical",
        "severity error",
        "severity warning",
        "severity informational",
        "cisco-fw",
        "severity emergencie",
        "severity emergencies",
        "severity errors"
      ],
      "remember": 10,
      "enable": true
    },
    {
      "type": "filtering",
      "collapse": false,
      "notice": true,
      "enable": true
    }
  ],
  "nav": [
    {
      "type": "timepicker",
      "collapse": false,
      "notice": false,
      "status": "Stable",
      "time_options": [
        "5m",
        "15m",
        "1h",
        "6h",
        "12h",
        "24h",
        "2d",
        "7d",
        "30d"
      ],
      "refresh_intervals": [
        "5s",
        "10s",
        "30s",
        "1m",
        "5m",
        "15m",
        "30m",
        "1h",
        "2h",
        "1d"
      ],
      "timefield": "@timestamp",
      "now": true,
      "filter_id": 0,
      "enable": true
    }
  ],
  "loader": {
    "save_gist": false,
    "save_elasticsearch": true,
    "save_local": true,
    "save_default": true,
    "save_temp": true,
    "save_temp_ttl_enable": true,
    "save_temp_ttl": "30d",
    "load_gist": true,
    "load_elasticsearch": true,
    "load_elasticsearch_size": 20,
    "load_local": true,
    "hide": false
  },
  "refresh": false
}
