This guide is a continuation of this blog post here. The following assumes that you already have an Elasticsearch instance set up and ready to go. This post will walk you through installing and setting up logstash for sending Cisco ASA messages to an Elasticsearch index.
As of today (6/16/2015), version 1.5.1 is the latest stable release of Logstash so I will be using 1.5.1 in my setup guide.
OPTIONAL
Before we begin sending data to Elasticsearch, it is probably a good idea to set up a custom template in Elasticsearch. This will set it so that specific fields are set for the correct types of data.
For example: By default, all data passed to a new index in elasticsearch is treated as a string type. You wouldn’t want this for something like the bytes field in case you wanted to add up all the bytes for a specific time window search. So you create a custom template so that the bytes field is stored as type long. This is totally optional but it is probably in your benifit to do this before you start collecting your ASA syslogs. You can read more about custom elasticsearch templates here or you can just copy mine by doing this…
Copy the text below, change the IP address at the top to the IP of your elasticsearch server and save it as template.sh on your desktop.
#!/bin/sh
curl -XPUT http://10.0.0.112:9200/_template/logstash_per_index -d '
{
    "template" : "logstash*",
    "mappings" : {
      "cisco-fw" : {
         "properties": {
            "@timestamp":{"type":"date","format":"dateOptionalTime"},
            "@version":{"type":"string", "index" : "not_analyzed"},
	    "action":{"type":"string"},
	    "bytes":{"type":"long"},
	    "cisco_message":{"type":"string"},
	    "ciscotag":{"type":"string", "index" : "not_analyzed"},
	    "connection_count":{"type":"long"},
            "connection_count_max":{"type":"long"},
	    "connection_id":{"type":"string"},
            "direction":{"type":"string"},
            "dst_interface":{"type":"string"},
	    "dst_ip":{"type":"string"},
            "dst_mapped_ip":{"type":"ip"},
	    "dst_mapped_port":{"type":"long"},
            "dst_port":{"type":"long"},
            "duration":{"type":"string"},
	    "err_dst_interface":{"type":"string"},
	    "err_dst_ip":{"type":"ip"},
	    "err_icmp_code":{"type":"string"},
	    "err_icmp_type":{"type":"string"},
	    "err_protocol":{"type":"string"},
            "err_src_interface":{"type":"string"},
            "err_src_ip":{"type":"ip"},
            "geoip":{
               "properties":{
                  "area_code":{"type":"long"},
                  "asn":{"type":"string", "index":"not_analyzed"},
                  "city_name":{"type":"string", "index":"not_analyzed"},
                  "continent_code":{"type":"string"},
                  "country_code2":{"type":"string"},
                  "country_code3":{"type":"string"},
                  "country_name":{"type":"string", "index":"not_analyzed"},
                  "dma_code":{"type":"long"},
                  "ip":{"type":"ip"},
                  "latitude":{"type":"double"},
                  "location":{"type":"geo_point"},
                  "longitude":{"type":"double"},
                  "number":{"type":"string"},
                  "postal_code":{"type":"string"},
                  "real_region_name":{"type":"string", "index":"not_analyzed"},
                  "region_name":{"type":"string", "index":"not_analyzed"},
                  "timezone":{"type":"string"}
               }
            },
            "group":{"type":"string"},
 	    "hashcode1": {"type": "string"},
 	    "hashcode2": {"type": "string"},
            "host":{"type":"string"},
            "icmp_code":{"type":"string"},
            "icmp_code_xlated":{"type":"string"},
            "icmp_seq_num":{"type":"string"},
            "icmp_type":{"type":"string"},
            "interface":{"type":"string"},
            "is_local_natted":{"type":"string"},
            "is_remote_natted":{"type":"string"},
            "message":{"type":"string"},
            "orig_dst_ip":{"type":"ip"},
            "orig_dst_port":{"type":"long"},
            "orig_protocol":{"type":"string"},
            "orig_src_ip":{"type":"ip"},
            "orig_src_port":{"type":"long"},
            "policy_id":{"type":"string"},
            "protocol":{"type":"string"},
            "reason":{"type":"string"},
            "seq_num":{"type":"long"},
            "spi":{"type":"string"},
            "src_interface":{"type":"string"},
            "src_ip":{"type":"ip"},
            "src_mapped_ip":{"type":"ip"},
            "src_mapped_port":{"type":"long"},
            "src_port":{"type":"long"},
            "src_xlated_interface":{"type":"string"},
            "src_xlated_ip":{"type":"ip"},
            "syslog_facility":{"type":"string"},
            "syslog_facility_code":{"type":"long"},
            "syslog_pri":{"type":"string"},
            "syslog_severity":{"type":"string"},
            "syslog_severity_code":{"type":"long"},
            "tags":{"type":"string"},
            "tcp_flags":{"type":"string"},
            "timestamp":{"type":"string"},
            "tunnel_type":{"type":"string"},
            "type":{"type":"string"},
            "user":{"type":"string"},
            "xlate_type":{"type":"string"}
      }
    }
  }
}'
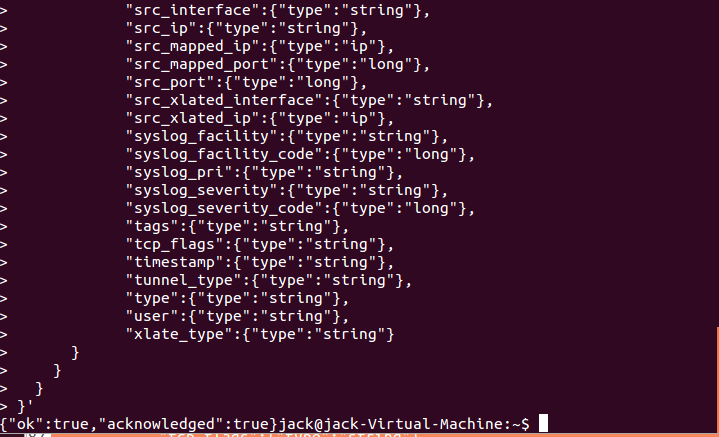
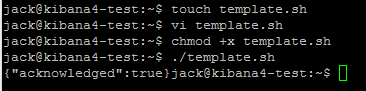
Save it and close. Now, open up a terminal window and change to the directory where the template.sh file is located. We need to set the script as executable so we can run it. Run the following commands in a terminal window…
cd Desktop
chmod +x template.sh
./template.sh
You should get back {“acknowledged”:true}
Now back to the tutorial…
Download and Install Java
If you are doing this on a fresh install of Ubuntu (like me), the first thing you’re going to need to do is install Java. Logstash requires at least Java 7 to function so let’s set that up. If you already have Java on your machine, you can skip to the next section. I will be using Java 8 in this example but you can run 7 or openjdk if you wish.
Open a terminal window (ctrl+shift+t) and type…
sudo apt-add-repository ppa:webupd8team/java
sudo apt-get update
sudo apt-get install oracle-java8-installer
Once you have accepted the license agreement, Java is ready to go.
Download and Install Logstash
Open a terminal window (ctrl+shift+t) and run these commands…
wget -O - http://packages.elasticsearch.org/GPG-KEY-elasticsearch | sudo apt-key add -
echo 'deb http://packages.elasticsearch.org/logstash/1.5/debian stable main' | sudo tee /etc/apt/sources.list.d/logstash.list
sudo apt-get update
sudo apt-get install logstash
Logstash Configuration
Logstash is now installed so now we need to write a configuration file so that we can do things like specify listening port, patterns, the IP of the Elasticsearch server etc.
A Logstash configuration file is basically built of 3 parts: The input (network protocol, listening port, data type etc.), the filter (patterns, grok filters, syslog severity etc.) and the output (IP address of the elasticsearch server logstash is shipping the modified data to etc.).
First and foremost, let’s create a blank logstash configuration file. Open up your terminal window and type…
sudo vi /etc/logstash/conf.d/logstash.conf
or if you don’t know how to use VI
sudo gedit /etc/logstash/conf.d/logstash.conf
I am going to post my logstash configuration file below and then I will explain each part of the file and what it is doing. So, copy my code, paste it into your logstash.conf file and follow along below making changes to your file as you see fit.
logstash.conf
input {
  	udp {
    		port => 5544
    		type => "cisco-fw"
  	}
}

filter {
	grok {
    		match => ["message", "%{CISCO_TAGGED_SYSLOG} %{GREEDYDATA:cisco_message}"]
  	}

  	# Extract fields from the each of the detailed message types
  	# The patterns provided below are included in core of LogStash 1.4.2.
	grok {
		match => [
  			"cisco_message", "%{CISCOFW106001}",
  			"cisco_message", "%{CISCOFW106006_106007_106010}",
  			"cisco_message", "%{CISCOFW106014}",
  			"cisco_message", "%{CISCOFW106015}",
  			"cisco_message", "%{CISCOFW106021}",
  			"cisco_message", "%{CISCOFW106023}",
  			"cisco_message", "%{CISCOFW106100}",
  			"cisco_message", "%{CISCOFW110002}",
  			"cisco_message", "%{CISCOFW302010}",
  			"cisco_message", "%{CISCOFW302013_302014_302015_302016}",
  			"cisco_message", "%{CISCOFW302020_302021}",
  			"cisco_message", "%{CISCOFW305011}",
  			"cisco_message", "%{CISCOFW313001_313004_313008}",
  			"cisco_message", "%{CISCOFW313005}",
  			"cisco_message", "%{CISCOFW402117}",
  			"cisco_message", "%{CISCOFW402119}",
  			"cisco_message", "%{CISCOFW419001}",
  			"cisco_message", "%{CISCOFW419002}",
  			"cisco_message", "%{CISCOFW500004}",
  			"cisco_message", "%{CISCOFW602303_602304}",
  			"cisco_message", "%{CISCOFW710001_710002_710003_710005_710006}",
  			"cisco_message", "%{CISCOFW713172}",
  			"cisco_message", "%{CISCOFW733100}"
		]
	}

  	# Parse the syslog severity and facility
  	syslog_pri { }

	geoip {
      		add_tag => [ "GeoIP" ]
      		database => "/opt/logstash/databases/GeoLiteCity.dat"
      		source => "src_ip"
    	}

	if [geoip][city_name]      == "" { mutate { remove_field => "[geoip][city_name]" } }
    	if [geoip][continent_code] == "" { mutate { remove_field => "[geoip][continent_code]" } }
    	if [geoip][country_code2]  == "" { mutate { remove_field => "[geoip][country_code2]" } }
    	if [geoip][country_code3]  == "" { mutate { remove_field => "[geoip][country_code3]" } }
    	if [geoip][country_name]   == "" { mutate { remove_field => "[geoip][country_name]" } }
    	if [geoip][latitude]       == "" { mutate { remove_field => "[geoip][latitude]" } }
    	if [geoip][longitude]      == "" { mutate { remove_field => "[geoip][longitude]" } }
    	if [geoip][postal_code]    == "" { mutate { remove_field => "[geoip][postal_code]" } }
    	if [geoip][region_name]    == "" { mutate { remove_field => "[geoip][region_name]" } }
    	if [geoip][time_zone]      == "" { mutate { remove_field => "[geoip][time_zone]" } }

	# Gets the source IP whois information from the GeoIPASNum.dat flat file database
	geoip {
      		add_tag => [ "Whois" ]
      		database => "/opt/logstash/databases/GeoIPASNum.dat"
      		source => "src_ip"
    	}

 	# Parse the date
  	date {
    		match => ["timestamp",
      			"MMM dd HH:mm:ss",
      			"MMM  d HH:mm:ss",
      			"MMM dd yyyy HH:mm:ss",
      			"MMM  d yyyy HH:mm:ss"
    		]
  	}
}

output {
	stdout {
		codec => json
	}

	elasticsearch {
    		host => "10.0.0.133"
    		flush_size => 1
	}
}
End of logstash.conf
Don’t freak out! I will walk you through my configuration file and explain what each section is doing. Like I said before, a logstash configuration file is made up of 3 parts: the input, the filter and the output. So let’s walk through it, shall we?
Note: All of my examples will be using this as an example ASA syslog message.
<182>May 07 2015 13:26:42: %ASA-6-302014: Teardown TCP connection 48809467 for outside:124.35.68.19/46505 to inside:10.10.10.32/443 duration 0:00:00 bytes 300 TCP FINs
The Input
input {
  udp {
    port => 5544
    type => "cisco-fw"
  }
}
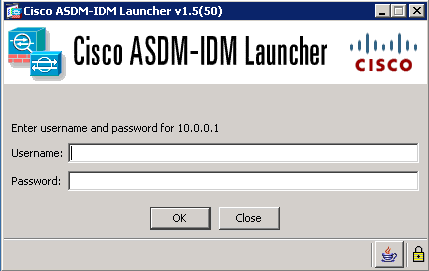
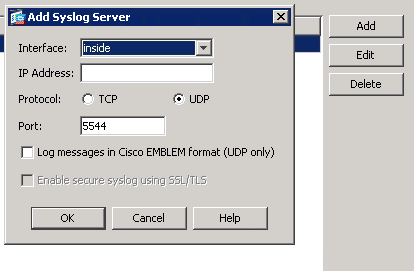
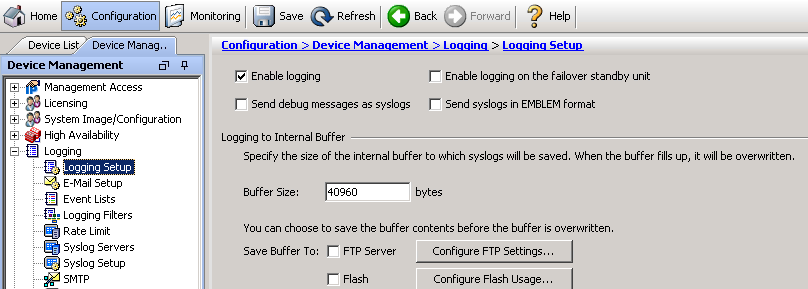
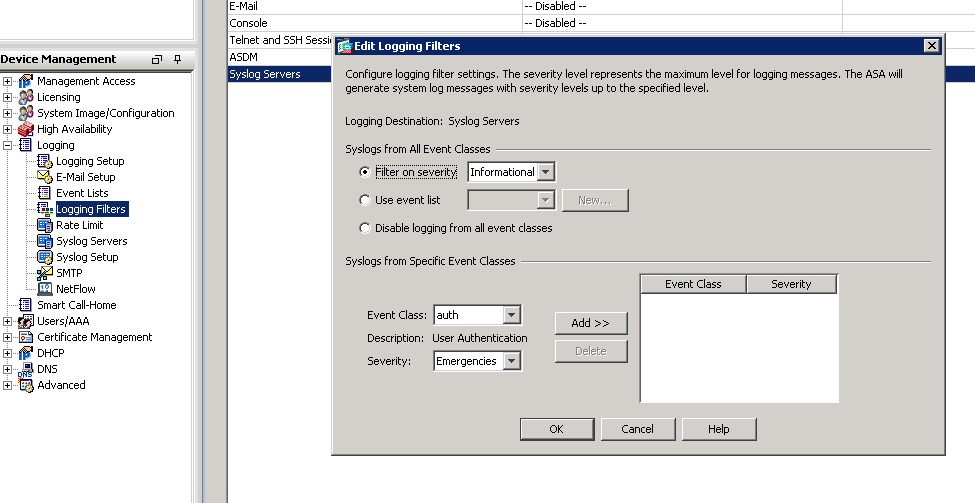
This tells logstash the protocol (UDP) and what port to listen (5544). You can make it any port you want but you just need to set it in your ASA firewall like so…
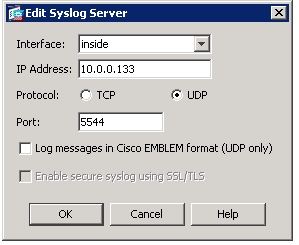
or for you CLI people…
logging enable
logging timestamp
logging buffer-size 40960
logging trap informational
logging facility 22
logging host inside 10.0.0.133 17/5544
You can learn more on how to set this up by checking out my ASA syslog tutorial here
The Filter
This is the filter section. This is where most of the work will be done in logstash. The is where you can do things like use grok patterns to split data into fields based off the message and other neat little features for manipulating your data. My filter section has 5 different parts: grok, syslog_pri, geoip, mutate and date. Let’s look at them individually and show what exactly they do.
Grok
filter {
	grok {
    		match => ["message", "%{CISCO_TAGGED_SYSLOG} %{GREEDYDATA:cisco_message}"]
  	...
}
This section is where you use patterns to match various elements of your log messages and extract them into fields. This specific pattern is using the CISCO_TAGGED_SYSLOG definition in the firewalls pattern built into logstash and splitting it into sections.
The CISCO_TAGGED_SYSLOG looks like this…
CISCO_TAGGED_SYSLOG ^<%{POSINT:syslog_pri}>%{CISCOTIMESTAMP:timestamp}( %{SYSLOGHOST:sysloghost})?: %%{CISCOTAG:ciscotag}:
and, based off our example ASA syslog May 07 2015 13:26:42: %ASA-6-302014: Teardown TCP connection 48809467 for outside:124.35.68.19/46505 to inside:10.10.10.32/443 duration 0:00:00 bytes 300 TCP FINs, it pulls out this into these fields…
syslog_pri = 182
timestamp = May 07 2015 13:26:42
sysloghost =
ciscotag = ASA-6-302014
and the rest of the message of Teardown TCP connection 48809467 for outside:124.35.68.19/46505 to inside:10.10.10.32/443 duration 0:00:00 bytes 300 TCP FINs is just is just set as GREEDYDATA:cisco_message, which will be used later in the next grok filter below.
grok {
    match => [
    	"cisco_message", "%{CISCOFW106001}",
    	....
    	"cisco_message", "%{CISCOFW733100}"
    ]
}
Now, using the GREEDYDATA:cisco_message from the previous grok filter, we are going to use the same firewall patterns file built into logstash and match the message type based off the message. The filter goes through all the patterns until it finds a match and then splits the contents of the message into fields. So, based off our GREEDYDATA:cisco_message of Teardown TCP connection 48809467 for outside:124.35.68.19/46505 to inside:10.10.10.32/443 duration 0:00:00 bytes 300 TCP FINs from our example syslog, it will try to match it against the patterns file. Our specific example matches the CISCOFW302013_302014_302015_302016 line in the patterns file, which reads…
CISCOFW302013_302014_302015_302016 %{CISCO_ACTION:action}(?: %{CISCO_DIRECTION:direction})? %{WORD:protocol} connection %{INT:connection_id} for %{DATA:src_interface}:%{IP:src_ip}/%{INT:src_port}( \(%{IP:src_mapped_ip}/%{INT:src_mapped_port}\))?(\(%{DATA:src_fwuser}\))? to %{DATA:dst_interface}:%{IP:dst_ip}/%{INT:dst_port}( \(%{IP:dst_mapped_ip}/%{INT:dst_mapped_port}\))?(\(%{DATA:dst_fwuser}\))?( duration %{TIME:duration} bytes %{INT:bytes})?(?: %{CISCO_REASON:reason})?( \(%{DATA:user}\))?
…and puts the data into these fields…
action = Teardown
protocol = TCP
connection_id = 48809467
src_interface = outside
src_ip = 124.35.68.19
src_port = 46505
dst_interface = inside
dst_ip = 10.10.10.32
dst_port = 443
duration = 0 =00 =00
bytes = 300
reason = TCP FINs
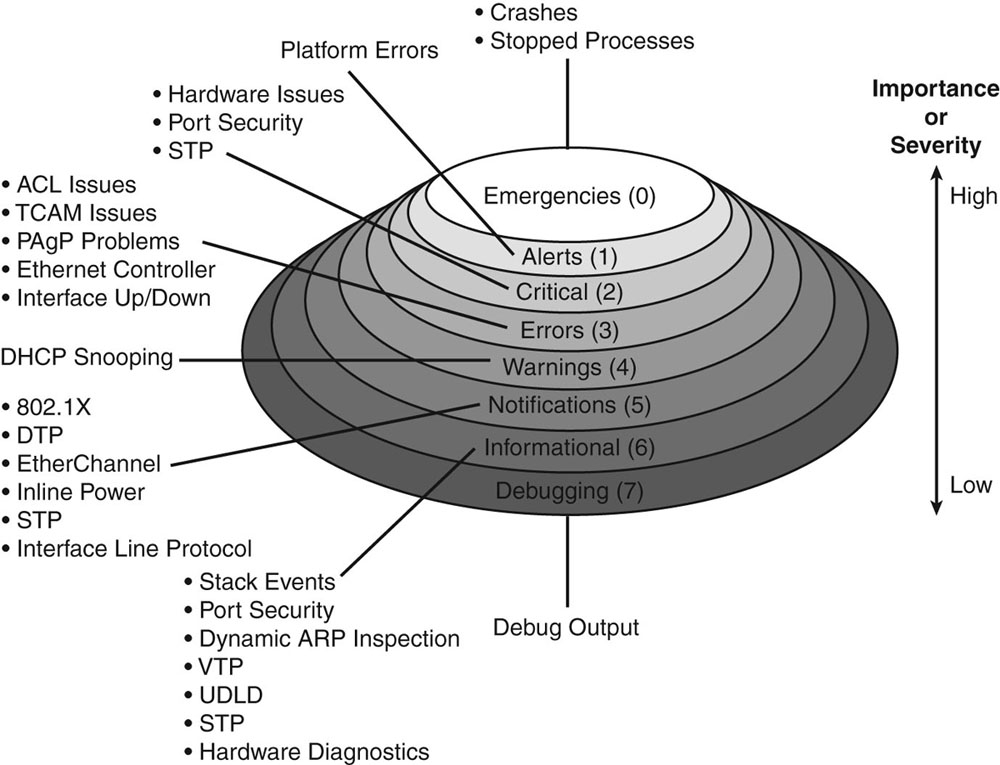
Syslog_pri
syslog_pri { }
This section takes the POSINT syslog_pri from the first grok filter and gets the facility and severity level of the syslog message. Our example had a syslog_pri number of 182 and logstash can determine that the message is an informational based message from the local6 facility. I was able to get that by referencing this chart and finding which column and row 182 fell under.
             emergency   alert   critical   error   warning   notice   info   debug
 kernel              0       1          2       3         4        5      6       7
 user                8       9         10      11        12       13     14      15
 mail               16      17         18      19        20       21     22      23
 system             24      25         26      27        28       29     30      31
 security           32      33         34      35        36       37     38      39
 syslog             40      41         42      43        44       45     46      47
 lpd                48      49         50      51        52       53     54      55
 nntp               56      57         58      59        60       61     62      63
 uucp               64      65         66      67        68       69     70      71
 time               72      73         74      75        76       77     78      79
 security           80      81         82      83        84       85     86      87
 ftpd               88      89         90      91        92       93     94      95
 ntpd               96      97         98      99       100      101    102     103
 logaudit          104     105        106     107       108      109    110     111
 logalert          112     113        114     115       116      117    118     119
 clock             120     121        122     123       124      125    126     127
 local0            128     129        130     131       132      133    134     135
 local1            136     137        138     139       140      141    142     143
 local2            144     145        146     147       148      149    150     151
 local3            152     153        154     155       156      157    158     159
 local4            160     161        162     163       164      165    166     167
 local5            168     169        170     171       172      173    174     175
 local6            176     177        178     179       180      181    182     183
 local7            184     185        186     187       188      189    190     191
Pretty cool stuff.
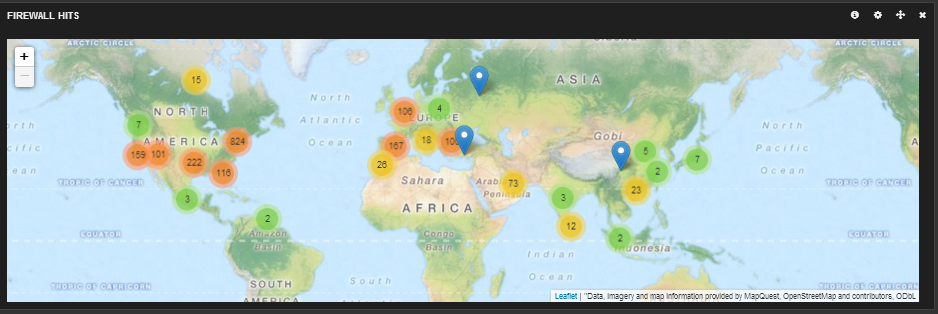
OPTIONAL: GeoIP
geoip {
    	add_tag => [ "GeoIP" ]
    	database => "/opt/logstash/databases/GeoLiteCity.dat"
    	source => "src_ip"
}
This part is completely optional and up to you if you want to set it up. What it does is it uses the source ip address in the syslog and it gets location data based of a flat file database. This flat file database will be used by logstash to get the location of the IP addresses hitting the firewall so you can get turn the source IP address of 124.35.68.19 into this…
"geoip": {
      "ip": "124.35.68.19",
      "country_code2": "US",
      "country_code3": "USA",
      "country_name": "United States",
      "continent_code": "NA",
      "region_name": "NJ",
      "city_name": "Edison",
      "postal_code": "08820",
      "latitude": 40.57669999999999,
      "longitude": -74.3674,
      "dma_code": 501,
      "area_code": 732,
      "timezone": "America/New_York",
      "real_region_name": "New Jersey",
      "location": [
        -74.3674,
        40.57669999999999
      ]
}
If this doesn’t interest you, remove the geoip section from the config file and skip to the next section. If this does interest you, follow the steps below.
Open a terminal window and type…
cd ~
wget http://geolite.maxmind.com/download/geoip/database/GeoLiteCity.dat.gz
sudo mkdir /opt/logstash/databases
gunzip GeoLiteCity.dat.gz
sudo mv ~/GeoLiteCity.dat /opt/logstash/databases/
and that is it for the first GeoIP tag for location data.
This is another optional GeoIP filter…
geoip {
    	add_tag => [ "Whois" ]
    	database => "/opt/logstash/databases/GeoIPASNum.dat"
    	source => "src_ip"
}
Just like the GeoIP location database, the GeoIP ASN database uses the source IP address, but instead of returning location information, it returns the ASN information. So essentially it turns 124.35.68.19 into…
"number": "AS6128",
"asn": "Cablevision Systems Corp."
So you can see ISP names in your elasticsearch searches. Also very cool and highly recommended for your setup. If this does not interest you for your setup, remove the geoip section from your configuration file and skip to the next section. If this does interest you, follow the steps below…
Open a terminal window and type…
cd ~
wget http://download.maxmind.com/download/geoip/database/asnum/GeoIPASNum.dat.gz
gunzip GeoIPASNum.dat.gz
sudo mv ~/GeoIPASNum.dat /opt/logstash/databases/
and that’s it with the GeoIP section.
Mutate
if [geoip][city_name] == "" { mutate { remove_field => "[geoip][city_name]" } }
This part is fairly straight forward. Basically what is happening is that if the entry in the GeoIPASNum.dat file for a particular IP address has a country but does not have a city, it will remove that field before it is inserted into elasticsearch. That is basically it with the mutate section of my config file.
Date
date {
    match => ["timestamp",
    	"MMM dd HH:mm:ss",
    	"MMM  d HH:mm:ss",
    	"MMM dd yyyy HH:mm:ss",
    	"MMM  d yyyy HH:mm:ss"
    ]
}
This part is also pretty straight forward. It takes the timestamp value from the first grok filter and sets it as the timestamp when putting it into elasticsearch. So basically, instead of the timestamp being set as the time when logstash received the message, the timestamp is set as when the event was triggered on the firewall based off the firewalls clock and hopefully the firewall is configured to use NTP so that all your devices clocks are synchronized.
Output
output {
	stdout {
		codec => json
	}

	elasticsearch {
		host => "10.0.0.133"
		flush_size => 1
	}
}
This section is how the final result is displayed/sent to various things. My output section has 2 parts: stdout and elasticsearch.
Stdout
stdout {
	codec => json
}
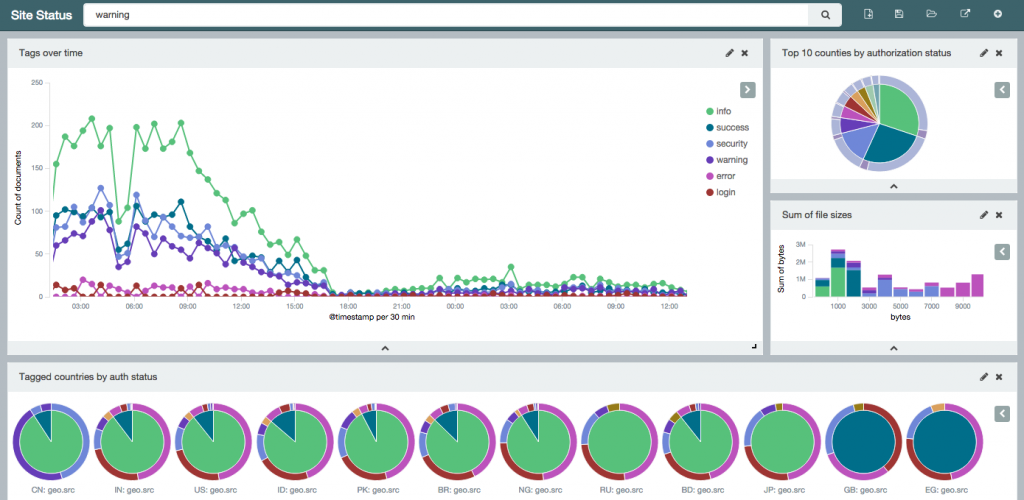
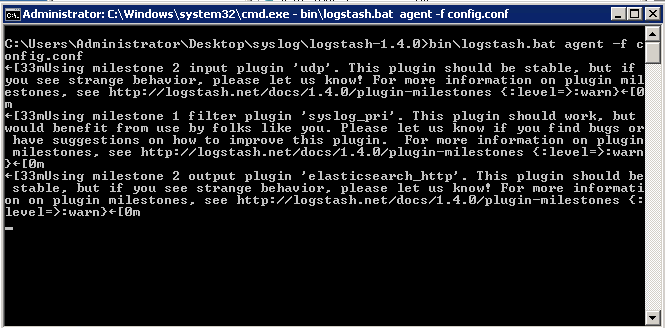
Stdout is optional but I have it in there so I can see if everything is working properly through the terminal window like so
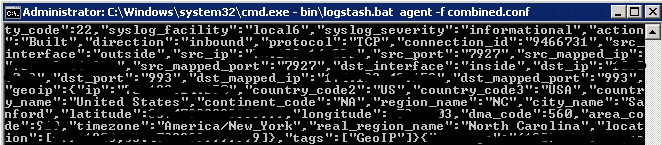
Obviously you do not need this part to run but I like to have it in there for debugging purposes.
Elasticsearch
elasticsearch {
    	host => "10.0.0.133"
    	flush_size => 1
}
Elasticsearch is where you specify the IP address of your elasticsearch server and that is pretty much it.
So now that you have your logstash.conf file set up, you can now run logstash for your ASA firewall. Save your config file and type in this into a terminal window…
/opt/logstash/bin/logstash -f /etc/logstash/conf.d/logstash.conf
That’s it, you’re finished.
Note: If you have not turned on syslog messages on your ASA firewall, read my other blog post here.