Install and Setup ADFS 2.0 on a Windows Server

ADFS, Blog, Information Technology, Microsoft, Servers, Software, Windows

Note: This guide assumes you have a Windows server, it is joined to a domain and you have an account that is part of the domain admins group.


First we need to install ADFS 2.0

  1. To install version 2.0, it first needs to be downloaded and installed. Click this link to download the installation file https://www.microsoft.com/en-au/download/details.aspx?id=10909
  2. Choose the type of installation file based on your OS (I am running Server 2008 R2 so I will choose RTW\W2K8R2\amd64\AdfsSetup.exe). Save the installation file to your Desktop
  3. Run the exe located on your desktop
  4. On the Welcome screen, click Next
  5. Accept the License Agreement.
  6. I will be setting this ADFS server as a Federation server so I will leave the default of Federation Server selected and I will click Next. Note: you would select Federation server proxy if you were running your ADFS server in something like a DMZ.
  7. Click Next on the prerequisite software screen. The install wizard will install these automatically if they are not already present on the system. If there are no errors, the software will be installed and the ADFS 2.0 management window will open

The next task is to create a certificate template to use with our SSL certificate

  1. The first thing you need to do is open the Server Manager (Start > Administrative Tools > Server Manager)
  2. Select Roles
  3. Click Add Roles
  4. Click Next to get past the Welcome Screen
  5. Check off Active Directory Certificate Services and click Next
    Select Roles
  6. Click Next to get past the Welcome Screen
  7. Click Next on the Role Services page
  8. Leave the default of Enterprise selected and click Next. Note: if Enterprise is not an option, you must log out of the server and log back in using an account that is a member of the Domain Administrators group.
  9. On the next page you need to decide between choosing a Root CA or a Subordinate CA. Select Root CA if you are OK with using a self-signed certificate for your ADFS instance. Select Subordinate CA if you would like to purchase a certificate from a 3rd party certificate authority. I will be using a self-signed certificate so I will select Root CA and click Next.
  10. Click Next on the Private Key page to create a new private key.
  11. Choose the type of cryptography you would like to use on the next page. I will leave the default of SHA1 with a 2048 bit key character length, but you can choose whatever you want. Then click Next
  12. Click Next on the CA Name page
  13. Choose how long you want the certificate to be valid. I will leave the default of 5 years set. Click Next
  14. Click Next on the Certificate Database page
  15. Click Install to finish and then close the wizard when complete
  16. Next open up the Certificate Authority (Start > Administrative Tools > Certificate Authority)
  17. Expand your server on the left column, right click Certificate Templates and click Manage
    manage
  18. Scroll down to the end of the list, right click Web Server and click Duplicate Template
    Duplicate Template
  19. Select Windows Server 2008 Enterprise and click OK. Note: you would select Windows Server 2003 only if you had 2003 servers on your network that needed to access the ADFS services.
  20. Give the template a name (ex: ADFS SSL Certificate)
  21. Next click on the Subject Name tab at the top.
  22. Click the Build from this Active Directory information radio button, select Common Name from the subject name format dropdown, uncheck User principal name (UPN) and check DNS name
    Template Properties
  23. In order for the ADFS server to obtain a certificate, it needs to have the correct permission set up to do so. To do this, select the Security tab at the top.
  24. To add the required permissions, click the Add
  25. Click the Object Types… button, check Computers on the newly opened window and click OK.
    Object Types
  26. Enter the name of the server that you previously installed ADFS on and click OK. The server will be added to the permission list.
  27. Next we need to set Enroll the allow permission for this particular server. Check Enroll and click OK
    Template Properties - Security
  28. Now we need to make this certificate template is available to be used to issue certificates. To do this, open up the Certificate Authority window again (Start > Administrative Tools > Certificate Authority)
  29. Right click the Certificate Templates icon in the left column, hover over New and click Certificate Template to Issue 
    Certificate Template to Issue
  30. Select the name of the template you made previously (in my example I made it ADFS SSL Certificate) and click OK.

The next task is to create a SSL certificate on the server that is compatible with ADFS

    1. Open up a management console window on your server (Start, type in mmc.exe and hit enter)
    2. Click file and click Add or Remove Snap-ins
    3. Highlight Certificates and click AddCertificates
    4. Select Computer Account and click Next and then click Finish
    5. Now that the options are configured, click OK
    6. On the Console window, click View and then select Options
      Options
    7. Select Certificate purpose and then click This will allow us to view the computer’s certificate by their purpose.
    8. In the Intended Purposes view, right click Server Authentication, hover over All Tasks and click Request New Certificate
      Request New Certificate
    9. Click Next on the welcome screen.
    10. Click Next on the Select Certificate Enrollment Policy
    11. Select the template you created before (ex: ADFS SSL Certificate) by checking it and clicking Enroll.
      Enroll
    12. Click Finish and close all of the open windows.


The next task will be to configure ADFS

  1. Open up ADFS management (Start > Administrative tools > AD FS 2.0 Management)
  2. On the ADFS 2.0 management window, click ADFS 2.0 Federation Server Configuration WizardWizard
  3. Leave the default of Create a new Federation Service selected and click Next
  4. On the Select Deployment Type page, select Stand-alone federation server and click Next
  5. Make sure your SSL certificate is selected on the Federation Service Name page and click Next
  6. Click Next on the summary screen and wait for the wizard to complete.
  7. One the wizard is finished, click Close. Now ADFS is installed and ready to be used.


Upgrade Active Directory Functional Level

Blog, Information Technology, Microsoft, Servers, Windows

If you are a systems administrator for an older company (like me), you probably have a few servers running Microsoft’s Windows Server 2003 operating system on your network. Most sysadmins are aware that support for Windows Server 2003 will end on July 14, 2015 (6 days from writing this post), which means no more software and security updates from the folks over in Redmond. Luckily our company has a big enough IT budget to have purchased Server 2008 licenses a long time ago but migrating servers is a slow and daunting task. One of the last 2003 servers we have on our network is a 2003 domain controller. Replacing this DC are two 2008 R2 AD servers but we need to demote the 2003 server and raise the functionality level of our domain so we can use new features like the AD recycle bin which lets admins restore deleted objects from active directory. Older AD functionality is still supported so any applications or services that used those functions will continue to work as before.


First we need to run demote the 2003 server.

Note: you need to have at least another domain controller in your network, otherwise you will lose your entire AD.

  1. On your 2003 domain controller, log in using a domain admins account.
  2. Click Start, and then click Run.
  3. In Open, type dcpromo to open the Active Directory Installation Wizard, and then click Next.
  4. On the Remove Active Directory page, click Next, and then continue to follow the wizard.

After your server is demoted, we need to raise the functionality of our domain.

To check the functionality level of your domain, open up powershell and type these commands

# Get the Forest functional level            
(Get-ADForest).ForestMode            
            
# Get the Domain functional level            
(Get-ADDomain).DomainMode

And you should get results like mine.

domain

Now, lets raise the functional level….

On your 2008 domain controller, open up Active Directory Domains and Trusts, right click your domain and click Raise Domain Functional Level… 

level

On the Raise domain functional level page, choose Windows Server 2008 if you AD is running Server 2008 or Windows Server 2008 R2 if you are running Server 2008 R2. Click Raise.

raise

That is it for the domain.

To raise the forest functional level, on the same Active Directory Domains and Trusts page, right click Active Directory Domains and Trusts and click Raise Forest Functional Level… 

level forest

Pick the appropriate forest functional level from before and click Raise.

raise forest

Check to see if the levels were raised using the same powershell commands from before.

# Get the Forest functional level            
(Get-ADForest).ForestMode            
            
# Get the Domain functional level            
(Get-ADDomain).DomainMode

You should see your updated results.

domain-new

And that is it. Good luck with the rest of you migration!

Enable Remote Desktop on a Remote Windows Server

Blog, Information Technology, Microsoft, Servers, Software, Windows

Scenario: you just finished installing some brand new servers in your server racks at the data center. You plugged them into your network, updated them with the latest windows updates and figured that you can finish the rest of the configuration while sitting at your desk at the office. Unfortunately you forgot to enable remote desktop and there is no way to get into the new machines.

Doh

Instead of driving all the way back to the data center, you can use these steps to enable remote desktop… remotely.

Steps

First you need to install PsExec from the Microsoft website http://technet.microsoft.com/en-us/sysinternals/bb897553

Extract the zip file, open a command window and cd to the newly extracted directory. (Ex. I extracted to a folder on my desktop called PSTools. Start>Run>Cmd>”cd  C:\Users\Developer\Desktop\PSTools”)

Next you need to run the command listed below. Mofidy the command by changing remoteserver to the IP of the remote server.

psexec \\remoteserver reg add "hklm\system\currentcontrolset\control\terminal server" /f /v fDenyTSConnections /t REG_DWORD /d 0

remoteregistry

This sets the registry value on the remote machine to enable and disable remote desktop connections.

Now we need to add the firewall exceptions to allow us remote access. Again, modify the commands below by changing remoteserver to the IP of the machine.

psexec \\remoteserver netsh firewall set service remoteadmin enable
psexec \\remoteserver netsh firewall set service remotedesktop enable

netshfirewall

After running those two commands, you should be able to remote desktop into that machine.

Using Logstash, Elasticsearch and Kibana for Cisco ASA Syslog Message Analysis.

Blog, Information Technology, Networking, Servers, Software

I originally wrote this as a comment on the Networking subreddit but I thought I would post this here in case anyone was curious on using open source tools for centralized logging.

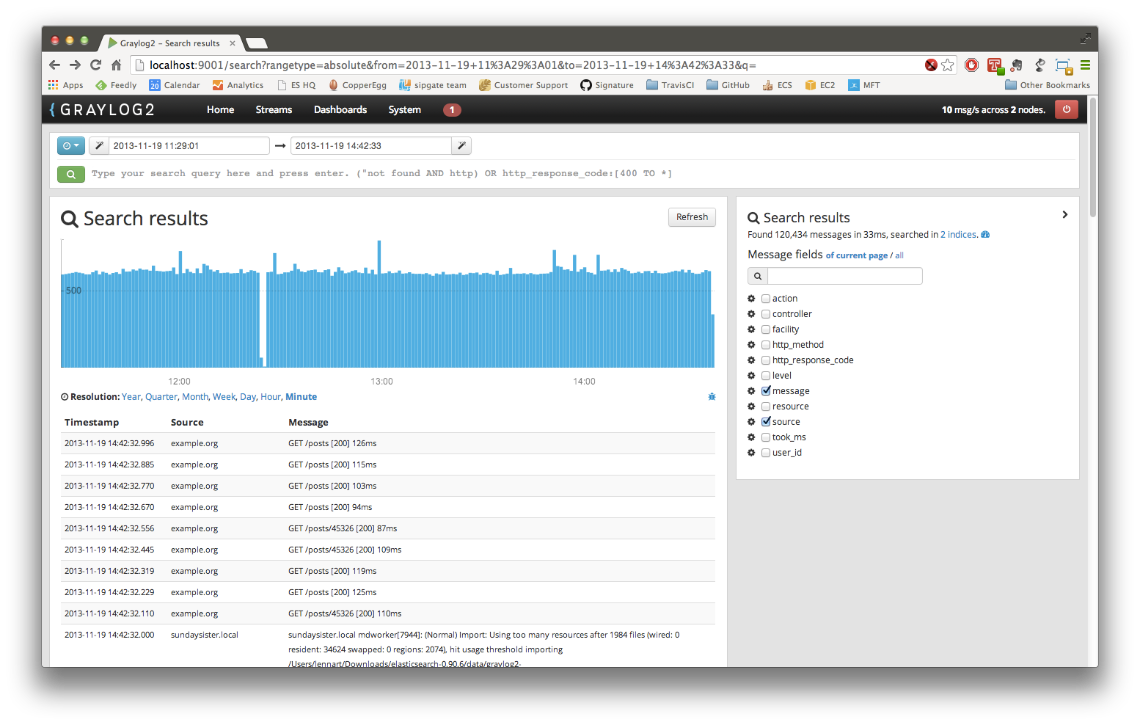
Originally we were using Graylog2 for message analysis but I recently found out about Kibana and it is substantially better. What this guide will do is help to transform raw syslog messages from your Cisco ASA like this…

<182>Apr 21 2014 11:51:03: %ASA-6-302014: Teardown TCP connection 9443865 for outside:123.456.789.10/9058 to inside:10.20.30.40/443 duration 0:00:20 bytes 3925 TCP FINs\n

and filter them into this…

{
 "_index": "logstash-2014.04.21",
 "_type": "cisco-fw",
 "_id": "I7yBKbUITHWxuMrAhaoNWQ",
 "_source": {
 "message": "<182>Apr 21 2014 11:51:03: %ASA-6-302014: Teardown TCP connection 9443865 for outside:123.456.789.10/9058 to inside:10.20.30.40/443 duration 0:00:20 bytes 3925 TCP FINs\n",
 "@version": "1",
 "@timestamp": "2014-04-21T15:51:03.000Z",
 "type": "cisco-fw",
 "host": "10.20.30.1",
 "syslog_pri": "182",
 "timestamp": "Apr 21 2014 11:51:03",
 "ciscotag": "ASA-6-302014",
 "cisco_message": "Teardown TCP connection 9443865 for outside:123.456.789.10/9058 to inside:10.20.30.40/443 duration 0:00:20 bytes 3925 TCP FINs",
 "syslog_severity_code": 6,
 "syslog_facility_code": 22,
 "syslog_facility": "local6",
 "syslog_severity": "informational",
 "action": "Teardown",
 "protocol": "TCP",
 "connection_id": "9443865",
 "src_interface": "outside",
 "src_ip": "123.456.789.10",
 "src_port": "9058",
 "dst_interface": "inside",
 "dst_ip": "10.20.30.40",
 "dst_port": "443",
 "duration": "0:00:20",
 "bytes": "3925",
 "reason": "TCP FINs",
 "tags": [
 "GeoIP"
 ]
 },
 "sort": [
 "apr",
 1398095463000
 ]
}

Using this newly created data, you can do things like see which IP is hitting your web servers the most, see which country is giving you the most traffic, see a graph of when your site is being accessed the most through out the day etc.

Here’s my setup

All three of these programs can be run on the same machine and also can be run on either OS (logstash & elasticsearch are java based and kibana is just html/js/css so all you need is apache) but my setup (and this guide) is what is listed above.


Download GeoIP database

First thing I did was download a IP – Lat/long database here. This flat file database will be used by logstash to get the location of the IP addresses hitting the firewall so you can map hits like this… bettermap

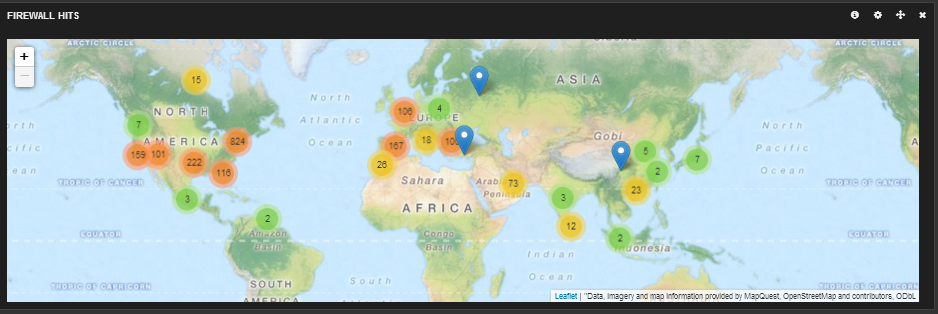
Unzip the file and remember where you put the GeoLiteCity.dat


Download Logstash 

Next I downloaded the latest version of Logstash. Unzip and throw somewhere on your computer.


Download and Install Elasticsearch 

Switch to you Ubuntu 12.04 LTS machine and open a terminal session (ctrl + alt + t) and enter these commands.

 cd ~
 sudo apt-get update
 sudo apt-get install openjdk-7-jre-headless -y
 wget https://download.elasticsearch.org/elasticsearch/elasticsearch/elasticsearch-1.3.1.deb
 sudo dpkg -i elasticsearch-1.3.1.deb

This will install java and Elasticsearch 1.3.1 on your machine.

Next you need to configure up elasticsearch on your machine.

sudo sed -i -e 's|# cluster.name: elasticsearch|cluster.name: kibana|' /etc/elasticsearch/elasticsearch.yml

Now you need to tell your machine to run elasticsearch on boot.

sudo update-rc.d elasticsearch defaults 95 10
sudo service elasticsearch restart

Installing Kibana

First you have to have Apache on your machine. There are plenty of guides on getting that set up if you are not familiar. Here is a good post about setting up Apache on Ubuntu. http://aarvik.dk/initial-web-server-setup-with-apache-mod_rewrite-and-virtual-host/

Next, download Kibana here.

  1. Extract your archive
  2. Open config.js in an editor
  3. Set the elasticsearch parameter to the fully qualified hostname of your Elasticsearch server
  4. Copy the contents of the extracted directory to your webserver
  5. Open your browser to kibana. (ex: http://127.0.0.1/kibana3)

Logstash Configuration
(Switch back to your Windows machine)

Next I created the logstash config file (logstash needs to know how to filter the syslog messages for parsing). Here is my config file…

input {
 udp { 
 port => 5544 ## change me to whatever you set your ASA syslog port to
 type => "cisco-fw"
 }
}

filter {
 ####### Cisco FW ####
 if [type] == "cisco-fw" {
 grok {
 match => ["message", "%{CISCO_TAGGED_SYSLOG} %{GREEDYDATA:cisco_message}"]
 }
 # Parse the syslog severity and facility
 syslog_pri { }

 # Extract fields from the each of the detailed message types
 # The patterns provided below are included in core of LogStash 1.2.0.
 grok {
 match => [
 "cisco_message", "%{CISCOFW106001}",
 "cisco_message", "%{CISCOFW106006_106007_106010}",
 "cisco_message", "%{CISCOFW106014}",
 "cisco_message", "%{CISCOFW106015}",
 "cisco_message", "%{CISCOFW106021}",
 "cisco_message", "%{CISCOFW106023}",
 "cisco_message", "%{CISCOFW106100}",
 "cisco_message", "%{CISCOFW110002}",
 "cisco_message", "%{CISCOFW302010}",
 "cisco_message", "%{CISCOFW302013_302014_302015_302016}",
 "cisco_message", "%{CISCOFW302020_302021}",
 "cisco_message", "%{CISCOFW305011}",
 "cisco_message", "%{CISCOFW313001_313004_313008}",
 "cisco_message", "%{CISCOFW313005}",
 "cisco_message", "%{CISCOFW402117}",
 "cisco_message", "%{CISCOFW402119}",
 "cisco_message", "%{CISCOFW419001}",
 "cisco_message", "%{CISCOFW419002}",
 "cisco_message", "%{CISCOFW500004}",
 "cisco_message", "%{CISCOFW602303_602304}",
 "cisco_message", "%{CISCOFW710001_710002_710003_710005_710006}",
 "cisco_message", "%{CISCOFW713172}",
 "cisco_message", "%{CISCOFW733100}"
 ]
 }

 geoip {
 add_tag => [ "GeoIP" ]
 database => "C:\GeoLiteCity.dat" ### Change me to location of GeoLiteCity.dat file
 source => "src_ip"
 }

 if [geoip][city_name] == "" { mutate { remove_field => "[geoip][city_name]" } }
 if [geoip][continent_code] == "" { mutate { remove_field => "[geoip][continent_code]" } }
 if [geoip][country_code2] == "" { mutate { remove_field => "[geoip][country_code2]" } }
 if [geoip][country_code3] == "" { mutate { remove_field => "[geoip][country_code3]" } }
 if [geoip][country_name] == "" { mutate { remove_field => "[geoip][country_name]" } }
 if [geoip][latitude] == "" { mutate { remove_field => "[geoip][latitude]" } }
 if [geoip][longitude] == "" { mutate { remove_field => "[geoip][longitude]" } }
 if [geoip][postal_code] == "" { mutate { remove_field => "[geoip][postal_code]" } }
 if [geoip][region_name] == "" { mutate { remove_field => "[geoip][region_name]" } }
 if [geoip][time_zone] == "" { mutate { remove_field => "[geoip][time_zone]" } }


 # Parse the date
 date {
 match => ["timestamp",
 "MMM dd HH:mm:ss",
 "MMM d HH:mm:ss",
 "MMM dd yyyy HH:mm:ss",
 "MMM d yyyy HH:mm:ss"
 ]
 }
 }
 ###### End of Cisco FW #######
}

output {
 stdout { 
 codec => json
 }

 elasticsearch_http {
 host => "10.0.0.123" # change me to the IP of your elasticsearch server
 }
}

Change the geoip location and elasticsearch IP address in your config file

geoip {
        add_tag => [ "GeoIP" ]
         database => "location of geolitecity.dat file. ex c:\geolitecity.dat"

and

elasticsearch_http { 
        host => "IP of elasticsearch server"

Save the config file in your Logstash folder as config.conf.

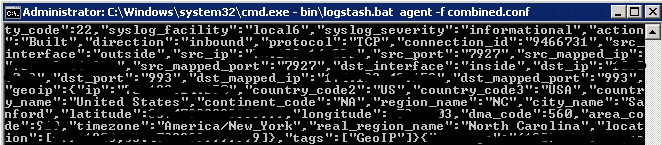
Next run Logstash with your newly created config file.

bin\logstash.bat agent -f config.conf

Logstash

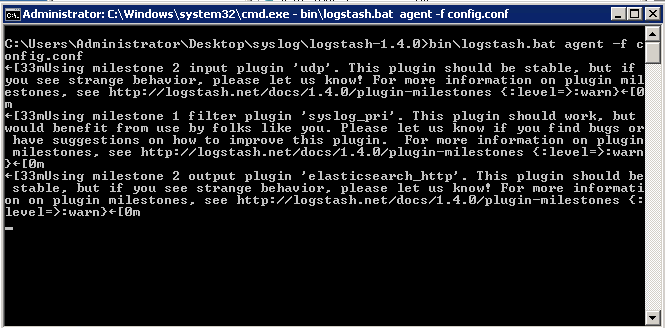
You might see warnings but you should not be seeing any errors


Cisco ASA configuration vis ASDM

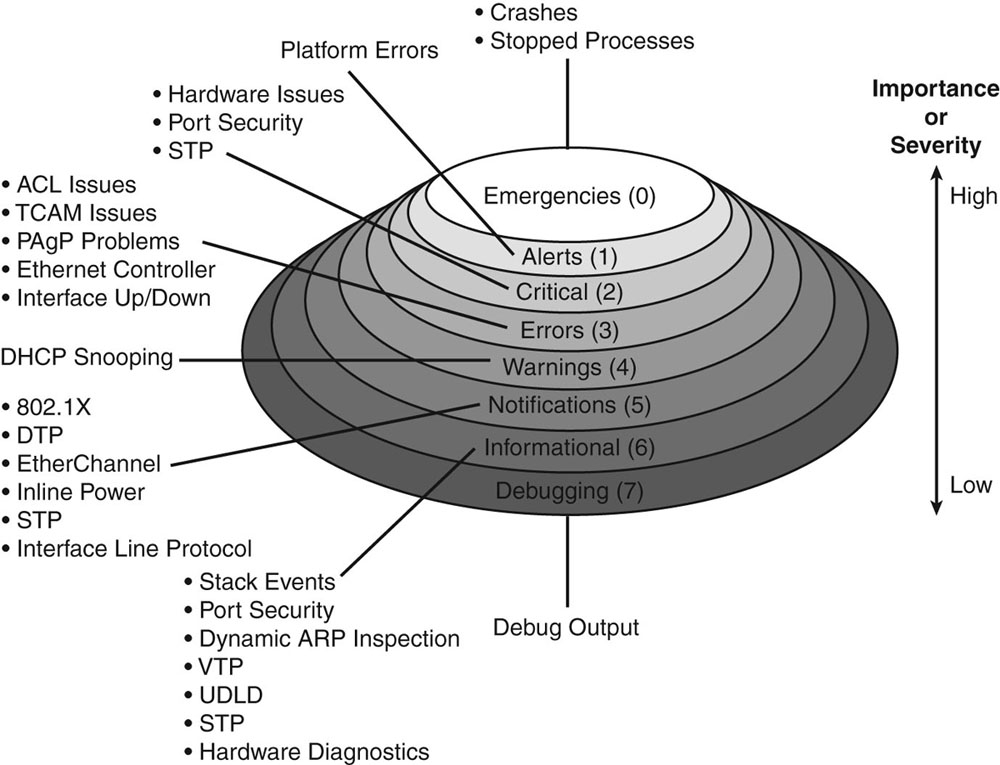
Follow my guide here to turn on syslogging on your ASA firewall. Set the IP to the IP address of the server running logstash and set the port to 5544 like in the logstash config file. I set my logging level to informational but you can set it to whatever level you want to log. Here is an explanation of the different logging levels with Cisco products.

Cisco Severity

As soon as you apply the config in the ASA, you should immediately start seeing results in your logstash window because one of the outputs was set to stdout.

Logstash2

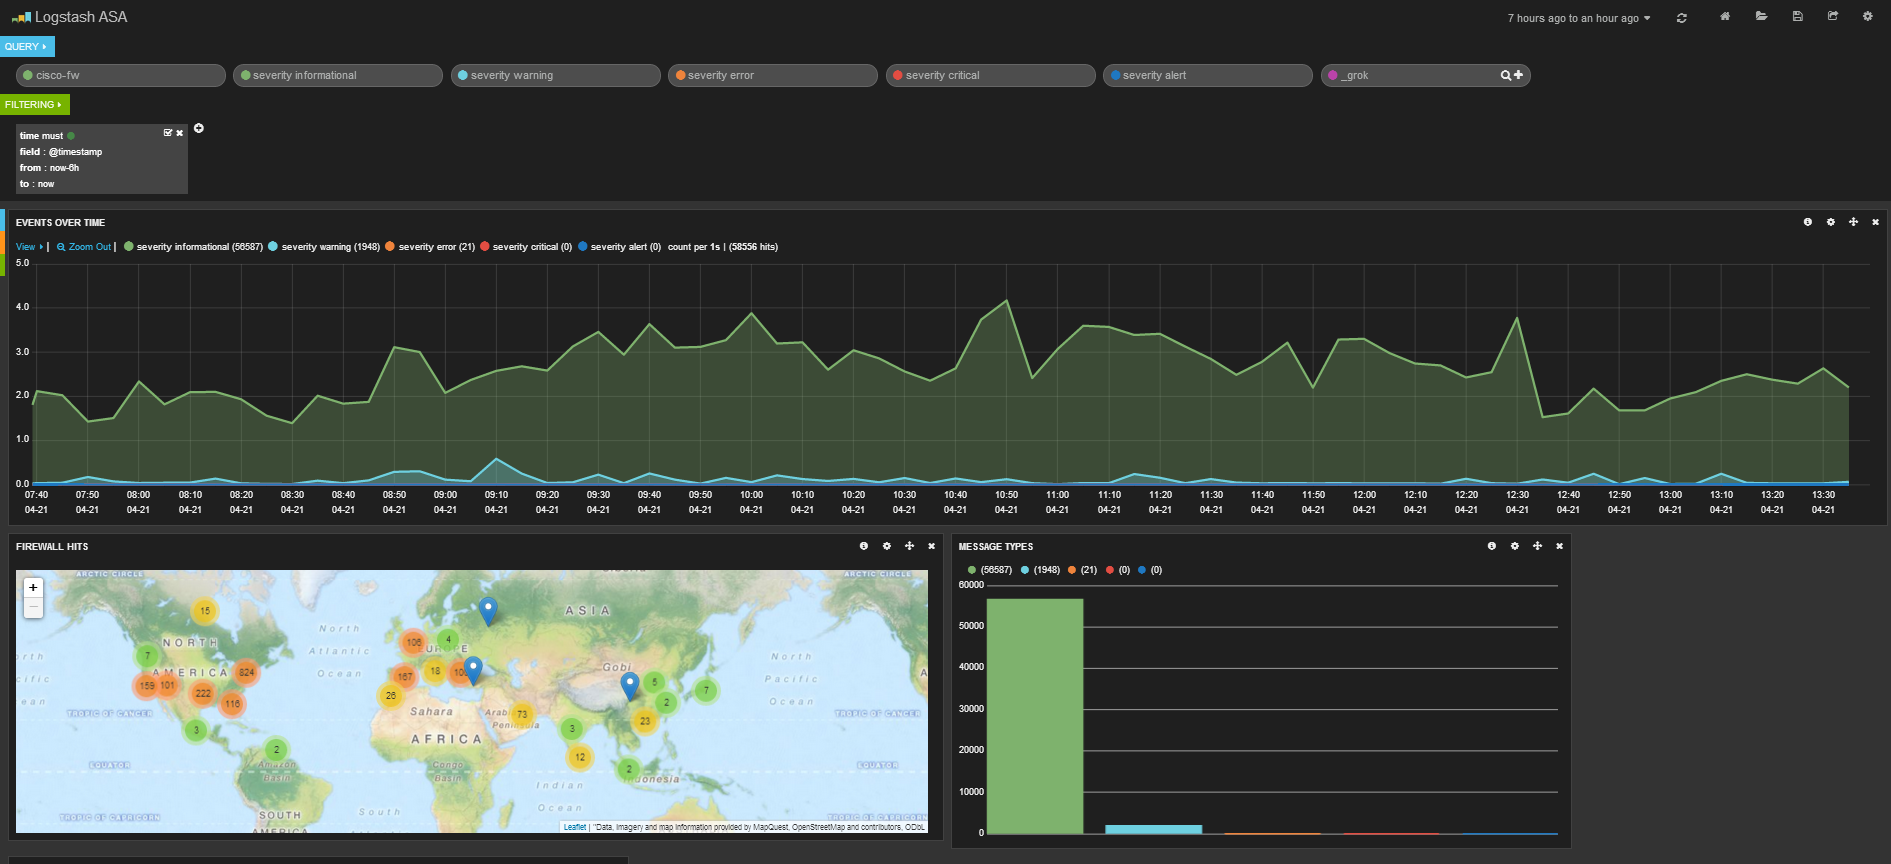
The messages are also going to your elasticsearch server. Open your browser to kibana and read the getting started guides. Once you configure your dashboard, you should start seeing results like this.

Kibana-wp1

Kibana-wp2


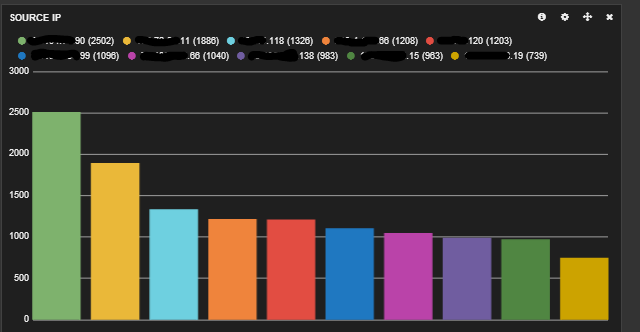
Here is my dashboard code in case you are curious. It shows a graph of message types, a map of hits, a graph of source and destination IPs, a histogram of messages per second and a list of the messages at the bottom.

To get this to work in Kibana…
1. Copy all of the code below
2. Save it as a text file
3. Go to Kibana
4. Click the Load icon at the top right of the page
5. Click Advanced
6. Click choose file and pick the file you just saved.

{
  "title": "Logstash ASA",
  "services": {
    "query": {
      "list": {
        "0": {
          "query": "cisco-fw",
          "alias": "",
          "color": "#7EB26D",
          "id": 0,
          "pin": false,
          "type": "lucene",
          "enable": true
        },
        "1": {
          "id": 1,
          "color": "#7EB26D",
          "alias": "",
          "pin": false,
          "type": "lucene",
          "enable": true,
          "query": "severity informational"
        },
        "2": {
          "id": 2,
          "color": "#6ED0E0",
          "alias": "",
          "pin": false,
          "type": "lucene",
          "enable": true,
          "query": "severity warning"
        },
        "3": {
          "id": 3,
          "color": "#EF843C",
          "alias": "",
          "pin": false,
          "type": "lucene",
          "enable": true,
          "query": "severity error"
        },
        "4": {
          "id": 4,
          "color": "#E24D42",
          "alias": "",
          "pin": false,
          "type": "lucene",
          "enable": true,
          "query": "severity critical"
        },
        "5": {
          "id": 5,
          "color": "#1F78C1",
          "alias": "",
          "pin": false,
          "type": "lucene",
          "enable": true,
          "query": "severity alert"
        },
        "6": {
          "id": 6,
          "color": "#BA43A9",
          "alias": "",
          "pin": false,
          "type": "lucene",
          "enable": true,
          "query": "_grok"
        }
      },
      "ids": [
        0,
        1,
        2,
        3,
        4,
        5,
        6
      ]
    },
    "filter": {
      "list": {
        "0": {
          "type": "time",
          "field": "@timestamp",
          "from": "now-6h",
          "to": "now",
          "mandate": "must",
          "active": true,
          "alias": "",
          "id": 0
        }
      },
      "ids": [
        0
      ]
    }
  },
  "rows": [
    {
      "title": "Graph",
      "height": "350px",
      "editable": true,
      "collapse": false,
      "collapsable": true,
      "panels": [
        {
          "span": 12,
          "editable": true,
          "group": [
            "default"
          ],
          "type": "histogram",
          "mode": "count",
          "time_field": "@timestamp",
          "value_field": null,
          "auto_int": true,
          "resolution": 100,
          "interval": "5m",
          "fill": 3,
          "linewidth": 3,
          "timezone": "browser",
          "spyable": true,
          "zoomlinks": true,
          "bars": false,
          "stack": false,
          "points": false,
          "lines": true,
          "legend": true,
          "x-axis": true,
          "y-axis": true,
          "percentage": false,
          "interactive": true,
          "queries": {
            "mode": "selected",
            "ids": [
              1,
              2,
              3,
              4,
              5
            ]
          },
          "title": "Events over time",
          "intervals": [
            "auto",
            "1s",
            "1m",
            "5m",
            "10m",
            "30m",
            "1h",
            "3h",
            "12h",
            "1d",
            "1w",
            "1M",
            "1y"
          ],
          "options": true,
          "tooltip": {
            "value_type": "cumulative",
            "query_as_alias": true
          },
          "scale": 1,
          "y_format": "none",
          "grid": {
            "max": null,
            "min": 0
          },
          "annotate": {
            "enable": false,
            "query": "*",
            "size": 20,
            "field": "_type",
            "sort": [
              "_score",
              "desc"
            ]
          },
          "pointradius": 5,
          "show_query": true,
          "legend_counts": true,
          "zerofill": true,
          "derivative": false,
          "scaleSeconds": true
        },
        {
          "error": false,
          "span": 6,
          "editable": true,
          "type": "bettermap",
          "loadingEditor": false,
          "field": "geoip.location",
          "size": 2000,
          "spyable": true,
          "tooltip": "_id",
          "queries": {
            "mode": "all",
            "ids": [
              0,
              1,
              2,
              3,
              4,
              5,
              6
            ]
          },
          "title": "Firewall Hits"
        },
        {
          "error": false,
          "span": 4,
          "editable": true,
          "type": "terms",
          "loadingEditor": false,
          "field": "syslog_severity",
          "exclude": [],
          "missing": true,
          "other": true,
          "size": 7,
          "order": "count",
          "style": {
            "font-size": "10pt"
          },
          "donut": false,
          "tilt": false,
          "labels": true,
          "arrangement": "horizontal",
          "chart": "bar",
          "counter_pos": "above",
          "spyable": true,
          "queries": {
            "mode": "all",
            "ids": [
              0,
              1,
              2,
              3,
              4,
              5,
              6
            ]
          },
          "tmode": "terms",
          "tstat": "total",
          "valuefield": "",
          "title": "Message Types"
        },
        {
          "error": false,
          "span": 4,
          "editable": true,
          "type": "terms",
          "loadingEditor": false,
          "field": "src_ip",
          "exclude": [],
          "missing": false,
          "other": false,
          "size": 10,
          "order": "count",
          "style": {
            "font-size": "10pt"
          },
          "donut": false,
          "tilt": false,
          "labels": true,
          "arrangement": "horizontal",
          "chart": "bar",
          "counter_pos": "above",
          "spyable": false,
          "queries": {
            "mode": "all",
            "ids": [
              0,
              1,
              2,
              3,
              4,
              5,
              6
            ]
          },
          "tmode": "terms",
          "tstat": "total",
          "valuefield": "",
          "title": "Source IP"
        },
        {
          "error": false,
          "span": 4,
          "editable": true,
          "type": "terms",
          "loadingEditor": false,
          "field": "dst_ip",
          "exclude": [],
          "missing": true,
          "other": true,
          "size": 10,
          "order": "count",
          "style": {
            "font-size": "10pt"
          },
          "donut": false,
          "tilt": false,
          "labels": true,
          "arrangement": "horizontal",
          "chart": "bar",
          "counter_pos": "above",
          "spyable": true,
          "queries": {
            "mode": "all",
            "ids": [
              0,
              1,
              2,
              3,
              4,
              5,
              6
            ]
          },
          "tmode": "terms",
          "tstat": "total",
          "valuefield": "",
          "title": "DESTINATION IP"
        }
      ],
      "notice": false
    },
    {
      "title": "Events",
      "height": "350px",
      "editable": true,
      "collapse": false,
      "collapsable": true,
      "panels": [
        {
          "title": "All events",
          "error": false,
          "span": 12,
          "editable": true,
          "group": [
            "default"
          ],
          "type": "table",
          "size": 100,
          "pages": 5,
          "offset": 0,
          "sort": [
            "timestamp",
            "desc"
          ],
          "style": {
            "font-size": "9pt"
          },
          "overflow": "min-height",
          "fields": [
            "duration",
            "cisco_message",
            "geoip.location",
            "direction",
            "src_ip",
            "dst_ip",
            "timestamp",
            "dst_port",
            "syslog_severity",
            "src_xlated_ip",
            "src_mapped_ip"
          ],
          "localTime": true,
          "timeField": "@timestamp",
          "highlight": [],
          "sortable": true,
          "header": true,
          "paging": true,
          "spyable": true,
          "queries": {
            "mode": "all",
            "ids": [
              0,
              1,
              2,
              3,
              4,
              5,
              6
            ]
          },
          "field_list": true,
          "status": "Stable",
          "trimFactor": 300,
          "normTimes": true,
          "all_fields": false
        }
      ],
      "notice": false
    }
  ],
  "editable": true,
  "failover": false,
  "index": {
    "interval": "day",
    "pattern": "[logstash-]YYYY.MM.DD",
    "default": "NO_TIME_FILTER_OR_INDEX_PATTERN_NOT_MATCHED",
    "warm_fields": true
  },
  "style": "dark",
  "panel_hints": true,
  "pulldowns": [
    {
      "type": "query",
      "collapse": false,
      "notice": false,
      "query": "*",
      "pinned": true,
      "history": [
        "_grok",
        "severity alert",
        "severity critical",
        "severity error",
        "severity warning",
        "severity informational",
        "cisco-fw",
        "severity emergencie",
        "severity emergencies",
        "severity errors"
      ],
      "remember": 10,
      "enable": true
    },
    {
      "type": "filtering",
      "collapse": false,
      "notice": true,
      "enable": true
    }
  ],
  "nav": [
    {
      "type": "timepicker",
      "collapse": false,
      "notice": false,
      "status": "Stable",
      "time_options": [
        "5m",
        "15m",
        "1h",
        "6h",
        "12h",
        "24h",
        "2d",
        "7d",
        "30d"
      ],
      "refresh_intervals": [
        "5s",
        "10s",
        "30s",
        "1m",
        "5m",
        "15m",
        "30m",
        "1h",
        "2h",
        "1d"
      ],
      "timefield": "@timestamp",
      "now": true,
      "filter_id": 0,
      "enable": true
    }
  ],
  "loader": {
    "save_gist": false,
    "save_elasticsearch": true,
    "save_local": true,
    "save_default": true,
    "save_temp": true,
    "save_temp_ttl_enable": true,
    "save_temp_ttl": "30d",
    "load_gist": true,
    "load_elasticsearch": true,
    "load_elasticsearch_size": 20,
    "load_local": true,
    "hide": false
  },
  "refresh": false
}


Simple Graylog2 install on Ubuntu 12.04

Blog, Servers, Software

Open Source software is the best – especially when the alternative closed source product costs a small fortune to run. What is not good about open source software is that sometimes it can be difficult to install because of non-comprehensive directions. Luckily there are people like MrLeSmithJr that write up easy to use install scripts so us Systems Administrators don’t have to tear small chunks of hair out of our heads trying to get things working.

I’ve been running Graylog2 for a couple of months and it is working very well. It is an open source data analytics system that is used for visually going through and managing the metric ton of log messages our devices/software generate daily. Give Graylog2 a try if Splunk is too expensive for you.

Here are the few steps to get Graylog2 0.20 running on your Ubuntu 12.04 install…

Open a terminal and type these commands…

sudo apt-get -y install git
cd ~
git clone https://github.com/mrlesmithjr/graylog2/
chmod +x ./graylog2/install_graylog2_20_ubuntu.sh
sudo ./graylog2/install_graylog2_20_ubuntu.sh

and that is it. You now have Graylog2 running on your Ubuntu install.