I originally wrote this as a comment on the Networking subreddit but I thought I would post this here in case anyone was curious on using open source tools for centralized logging.
Originally we were using Graylog2 for message analysis but I recently found out about Kibana and it is substantially better. What this guide will do is help to transform raw syslog messages from your Cisco ASA like this…
<182>Apr 21 2014 11:51:03: %ASA-6-302014: Teardown TCP connection 9443865 for outside:123.456.789.10/9058 to inside:10.20.30.40/443 duration 0:00:20 bytes 3925 TCP FINs\n
and filter them into this…
{
 "_index": "logstash-2014.04.21",
 "_type": "cisco-fw",
 "_id": "I7yBKbUITHWxuMrAhaoNWQ",
 "_source": {
 "message": "<182>Apr 21 2014 11:51:03: %ASA-6-302014: Teardown TCP connection 9443865 for outside:123.456.789.10/9058 to inside:10.20.30.40/443 duration 0:00:20 bytes 3925 TCP FINs\n",
 "@version": "1",
 "@timestamp": "2014-04-21T15:51:03.000Z",
 "type": "cisco-fw",
 "host": "10.20.30.1",
 "syslog_pri": "182",
 "timestamp": "Apr 21 2014 11:51:03",
 "ciscotag": "ASA-6-302014",
 "cisco_message": "Teardown TCP connection 9443865 for outside:123.456.789.10/9058 to inside:10.20.30.40/443 duration 0:00:20 bytes 3925 TCP FINs",
 "syslog_severity_code": 6,
 "syslog_facility_code": 22,
 "syslog_facility": "local6",
 "syslog_severity": "informational",
 "action": "Teardown",
 "protocol": "TCP",
 "connection_id": "9443865",
 "src_interface": "outside",
 "src_ip": "123.456.789.10",
 "src_port": "9058",
 "dst_interface": "inside",
 "dst_ip": "10.20.30.40",
 "dst_port": "443",
 "duration": "0:00:20",
 "bytes": "3925",
 "reason": "TCP FINs",
 "tags": [
 "GeoIP"
 ]
 },
 "sort": [
 "apr",
 1398095463000
 ]
}
Using this newly created data, you can do things like see which IP is hitting your web servers the most, see which country is giving you the most traffic, see a graph of when your site is being accessed the most through out the day etc.
Here’s my setup
- Cisco ASA with syslog turned on
- Windows server running Logstash 1.40
- Ubuntu 12.04 running Elasticsearch and Kibana
All three of these programs can be run on the same machine and also can be run on either OS (logstash & elasticsearch are java based and kibana is just html/js/css so all you need is apache) but my setup (and this guide) is what is listed above.
Download GeoIP database
First thing I did was download a IP – Lat/long database here. This flat file database will be used by logstash to get the location of the IP addresses hitting the firewall so you can map hits like this… 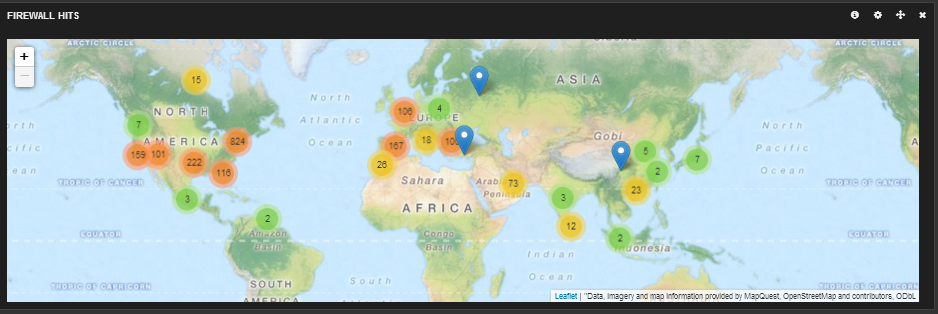
Unzip the file and remember where you put the GeoLiteCity.dat
Download Logstash
Next I downloaded the latest version of Logstash. Unzip and throw somewhere on your computer.
Download and Install Elasticsearch
Switch to you Ubuntu 12.04 LTS machine and open a terminal session (ctrl + alt + t) and enter these commands.
 cd ~
 sudo apt-get update
 sudo apt-get install openjdk-7-jre-headless -y
 wget https://download.elasticsearch.org/elasticsearch/elasticsearch/elasticsearch-1.3.1.deb
 sudo dpkg -i elasticsearch-1.3.1.deb
This will install java and Elasticsearch 1.3.1 on your machine.
Next you need to configure up elasticsearch on your machine.
sudo sed -i -e 's|# cluster.name: elasticsearch|cluster.name: kibana|' /etc/elasticsearch/elasticsearch.yml
Now you need to tell your machine to run elasticsearch on boot.
sudo update-rc.d elasticsearch defaults 95 10
sudo service elasticsearch restart
Installing Kibana
First you have to have Apache on your machine. There are plenty of guides on getting that set up if you are not familiar. Here is a good post about setting up Apache on Ubuntu. http://aarvik.dk/initial-web-server-setup-with-apache-mod_rewrite-and-virtual-host/
Next, download Kibana here.
- Extract your archive
- Open config.js in an editor
- Set the elasticsearch parameter to the fully qualified hostname of your Elasticsearch server
- Copy the contents of the extracted directory to your webserver
- Open your browser to kibana. (ex: http://127.0.0.1/kibana3)
Logstash Configuration
(Switch back to your Windows machine)
Next I created the logstash config file (logstash needs to know how to filter the syslog messages for parsing). Here is my config file…
input {
 udp {
 port => 5544 ## change me to whatever you set your ASA syslog port to
 type => "cisco-fw"
 }
}

filter {
 ####### Cisco FW ####
 if [type] == "cisco-fw" {
 grok {
 match => ["message", "%{CISCO_TAGGED_SYSLOG} %{GREEDYDATA:cisco_message}"]
 }
 # Parse the syslog severity and facility
 syslog_pri { }

 # Extract fields from the each of the detailed message types
 # The patterns provided below are included in core of LogStash 1.2.0.
 grok {
 match => [
 "cisco_message", "%{CISCOFW106001}",
 "cisco_message", "%{CISCOFW106006_106007_106010}",
 "cisco_message", "%{CISCOFW106014}",
 "cisco_message", "%{CISCOFW106015}",
 "cisco_message", "%{CISCOFW106021}",
 "cisco_message", "%{CISCOFW106023}",
 "cisco_message", "%{CISCOFW106100}",
 "cisco_message", "%{CISCOFW110002}",
 "cisco_message", "%{CISCOFW302010}",
 "cisco_message", "%{CISCOFW302013_302014_302015_302016}",
 "cisco_message", "%{CISCOFW302020_302021}",
 "cisco_message", "%{CISCOFW305011}",
 "cisco_message", "%{CISCOFW313001_313004_313008}",
 "cisco_message", "%{CISCOFW313005}",
 "cisco_message", "%{CISCOFW402117}",
 "cisco_message", "%{CISCOFW402119}",
 "cisco_message", "%{CISCOFW419001}",
 "cisco_message", "%{CISCOFW419002}",
 "cisco_message", "%{CISCOFW500004}",
 "cisco_message", "%{CISCOFW602303_602304}",
 "cisco_message", "%{CISCOFW710001_710002_710003_710005_710006}",
 "cisco_message", "%{CISCOFW713172}",
 "cisco_message", "%{CISCOFW733100}"
 ]
 }

 geoip {
 add_tag => [ "GeoIP" ]
 database => "C:\GeoLiteCity.dat" ### Change me to location of GeoLiteCity.dat file
 source => "src_ip"
 }

 if [geoip][city_name] == "" { mutate { remove_field => "[geoip][city_name]" } }
 if [geoip][continent_code] == "" { mutate { remove_field => "[geoip][continent_code]" } }
 if [geoip][country_code2] == "" { mutate { remove_field => "[geoip][country_code2]" } }
 if [geoip][country_code3] == "" { mutate { remove_field => "[geoip][country_code3]" } }
 if [geoip][country_name] == "" { mutate { remove_field => "[geoip][country_name]" } }
 if [geoip][latitude] == "" { mutate { remove_field => "[geoip][latitude]" } }
 if [geoip][longitude] == "" { mutate { remove_field => "[geoip][longitude]" } }
 if [geoip][postal_code] == "" { mutate { remove_field => "[geoip][postal_code]" } }
 if [geoip][region_name] == "" { mutate { remove_field => "[geoip][region_name]" } }
 if [geoip][time_zone] == "" { mutate { remove_field => "[geoip][time_zone]" } }


 # Parse the date
 date {
 match => ["timestamp",
 "MMM dd HH:mm:ss",
 "MMM d HH:mm:ss",
 "MMM dd yyyy HH:mm:ss",
 "MMM d yyyy HH:mm:ss"
 ]
 }
 }
 ###### End of Cisco FW #######
}

output {
 stdout {
 codec => json
 }

 elasticsearch_http {
 host => "10.0.0.123" # change me to the IP of your elasticsearch server
 }
}
Change the geoip location and elasticsearch IP address in your config file
geoip {
        add_tag => [ "GeoIP" ]
         database => "location of geolitecity.dat file. ex c:\geolitecity.dat"
and
elasticsearch_http {
        host => "IP of elasticsearch server"
Save the config file in your Logstash folder as config.conf.
Next run Logstash with your newly created config file.
bin\logstash.bat agent -f config.conf
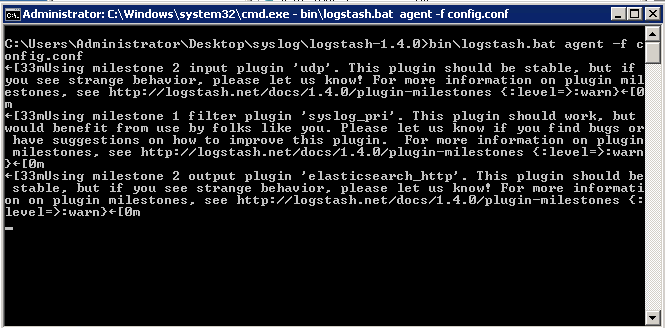
You might see warnings but you should not be seeing any errors
Cisco ASA configuration vis ASDM
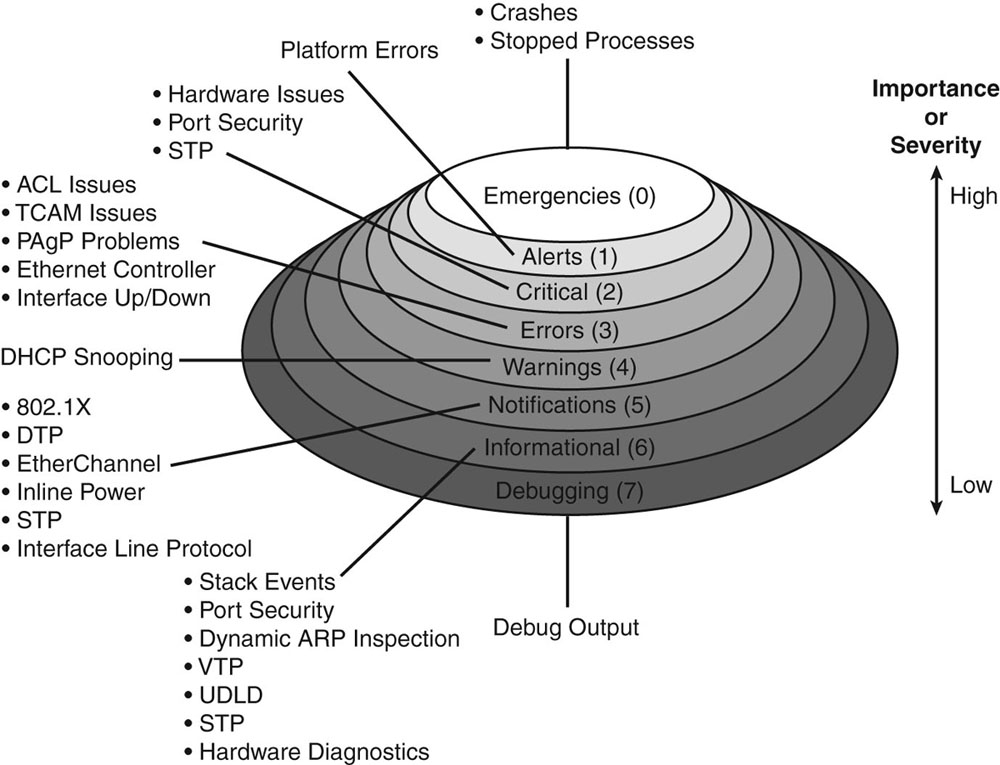
Follow my guide here to turn on syslogging on your ASA firewall. Set the IP to the IP address of the server running logstash and set the port to 5544 like in the logstash config file. I set my logging level to informational but you can set it to whatever level you want to log. Here is an explanation of the different logging levels with Cisco products.
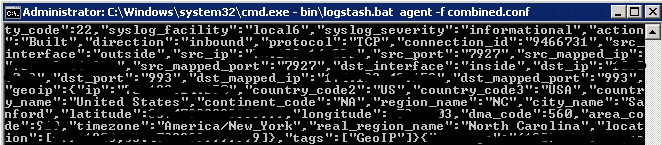
As soon as you apply the config in the ASA, you should immediately start seeing results in your logstash window because one of the outputs was set to stdout.
The messages are also going to your elasticsearch server. Open your browser to kibana and read the getting started guides. Once you configure your dashboard, you should start seeing results like this.
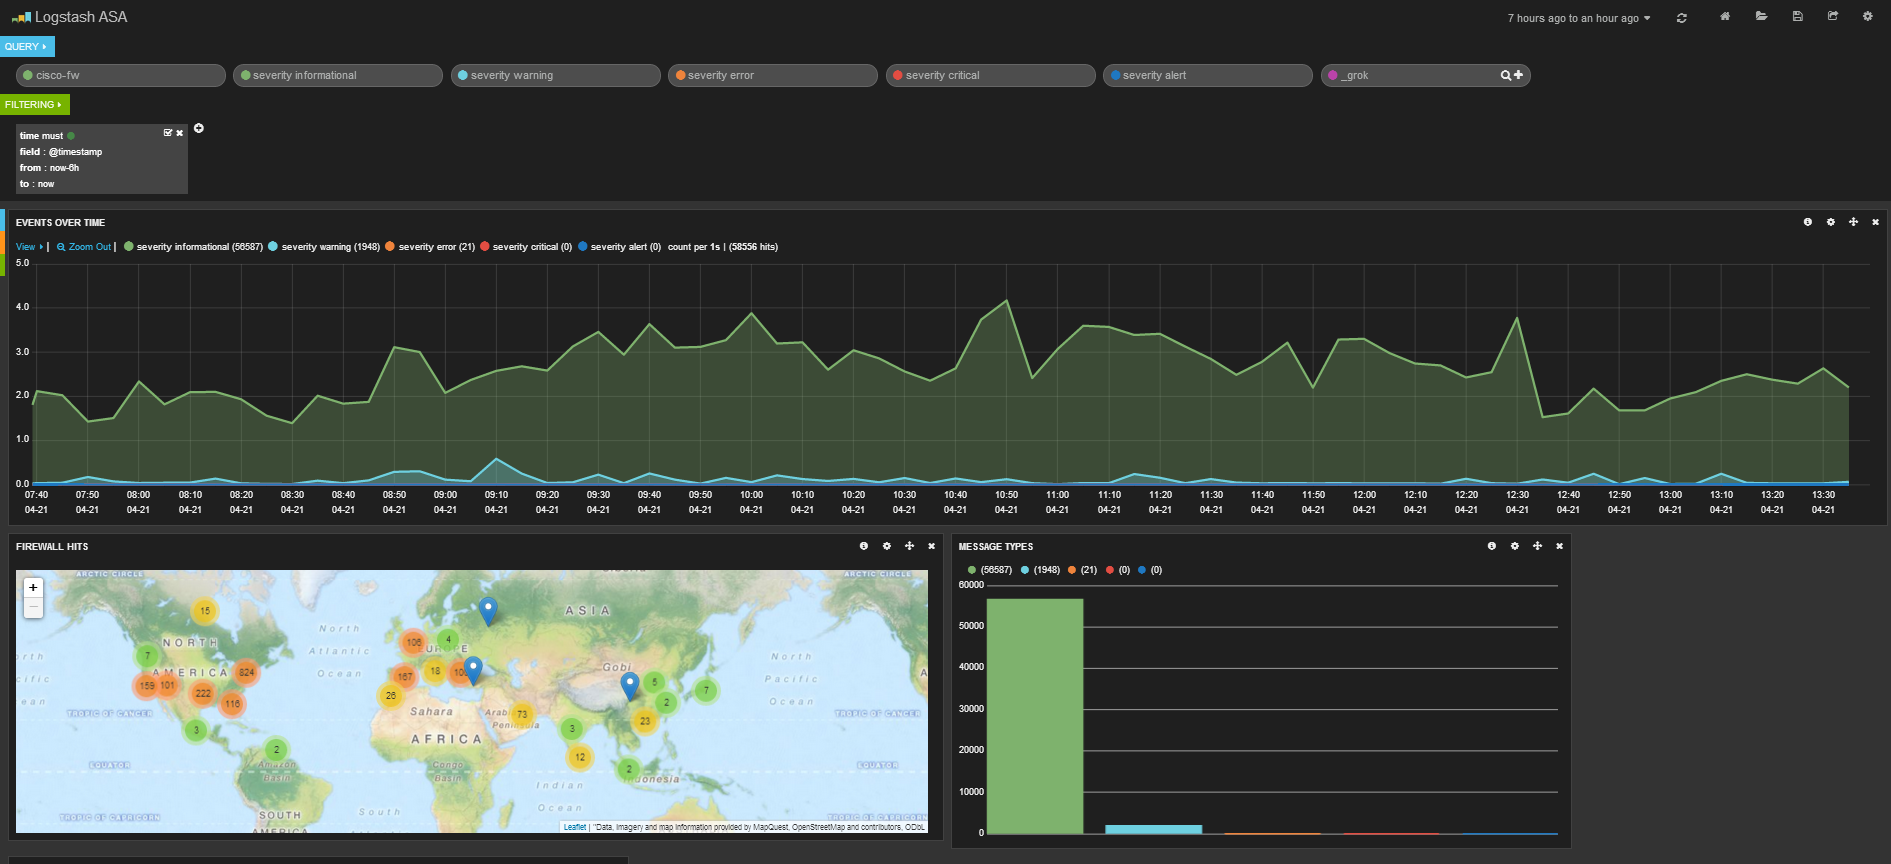
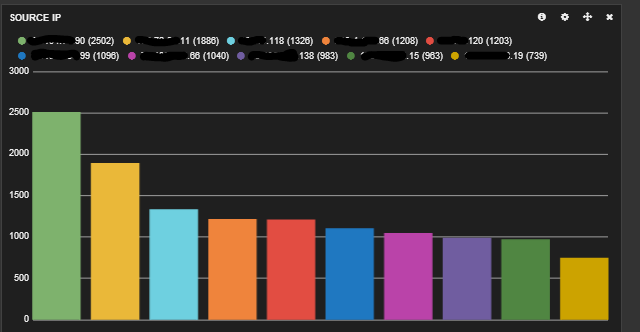
Here is my dashboard code in case you are curious. It shows a graph of message types, a map of hits, a graph of source and destination IPs, a histogram of messages per second and a list of the messages at the bottom.
To get this to work in Kibana…
1. Copy all of the code below
2. Save it as a text file
3. Go to Kibana
4. Click the Load icon at the top right of the page
5. Click Advanced
6. Click choose file and pick the file you just saved.
{
  "title": "Logstash ASA",
  "services": {
    "query": {
      "list": {
        "0": {
          "query": "cisco-fw",
          "alias": "",
          "color": "#7EB26D",
          "id": 0,
          "pin": false,
          "type": "lucene",
          "enable": true
        },
        "1": {
          "id": 1,
          "color": "#7EB26D",
          "alias": "",
          "pin": false,
          "type": "lucene",
          "enable": true,
          "query": "severity informational"
        },
        "2": {
          "id": 2,
          "color": "#6ED0E0",
          "alias": "",
          "pin": false,
          "type": "lucene",
          "enable": true,
          "query": "severity warning"
        },
        "3": {
          "id": 3,
          "color": "#EF843C",
          "alias": "",
          "pin": false,
          "type": "lucene",
          "enable": true,
          "query": "severity error"
        },
        "4": {
          "id": 4,
          "color": "#E24D42",
          "alias": "",
          "pin": false,
          "type": "lucene",
          "enable": true,
          "query": "severity critical"
        },
        "5": {
          "id": 5,
          "color": "#1F78C1",
          "alias": "",
          "pin": false,
          "type": "lucene",
          "enable": true,
          "query": "severity alert"
        },
        "6": {
          "id": 6,
          "color": "#BA43A9",
          "alias": "",
          "pin": false,
          "type": "lucene",
          "enable": true,
          "query": "_grok"
        }
      },
      "ids": [
        0,
        1,
        2,
        3,
        4,
        5,
        6
      ]
    },
    "filter": {
      "list": {
        "0": {
          "type": "time",
          "field": "@timestamp",
          "from": "now-6h",
          "to": "now",
          "mandate": "must",
          "active": true,
          "alias": "",
          "id": 0
        }
      },
      "ids": [
        0
      ]
    }
  },
  "rows": [
    {
      "title": "Graph",
      "height": "350px",
      "editable": true,
      "collapse": false,
      "collapsable": true,
      "panels": [
        {
          "span": 12,
          "editable": true,
          "group": [
            "default"
          ],
          "type": "histogram",
          "mode": "count",
          "time_field": "@timestamp",
          "value_field": null,
          "auto_int": true,
          "resolution": 100,
          "interval": "5m",
          "fill": 3,
          "linewidth": 3,
          "timezone": "browser",
          "spyable": true,
          "zoomlinks": true,
          "bars": false,
          "stack": false,
          "points": false,
          "lines": true,
          "legend": true,
          "x-axis": true,
          "y-axis": true,
          "percentage": false,
          "interactive": true,
          "queries": {
            "mode": "selected",
            "ids": [
              1,
              2,
              3,
              4,
              5
            ]
          },
          "title": "Events over time",
          "intervals": [
            "auto",
            "1s",
            "1m",
            "5m",
            "10m",
            "30m",
            "1h",
            "3h",
            "12h",
            "1d",
            "1w",
            "1M",
            "1y"
          ],
          "options": true,
          "tooltip": {
            "value_type": "cumulative",
            "query_as_alias": true
          },
          "scale": 1,
          "y_format": "none",
          "grid": {
            "max": null,
            "min": 0
          },
          "annotate": {
            "enable": false,
            "query": "*",
            "size": 20,
            "field": "_type",
            "sort": [
              "_score",
              "desc"
            ]
          },
          "pointradius": 5,
          "show_query": true,
          "legend_counts": true,
          "zerofill": true,
          "derivative": false,
          "scaleSeconds": true
        },
        {
          "error": false,
          "span": 6,
          "editable": true,
          "type": "bettermap",
          "loadingEditor": false,
          "field": "geoip.location",
          "size": 2000,
          "spyable": true,
          "tooltip": "_id",
          "queries": {
            "mode": "all",
            "ids": [
              0,
              1,
              2,
              3,
              4,
              5,
              6
            ]
          },
          "title": "Firewall Hits"
        },
        {
          "error": false,
          "span": 4,
          "editable": true,
          "type": "terms",
          "loadingEditor": false,
          "field": "syslog_severity",
          "exclude": [],
          "missing": true,
          "other": true,
          "size": 7,
          "order": "count",
          "style": {
            "font-size": "10pt"
          },
          "donut": false,
          "tilt": false,
          "labels": true,
          "arrangement": "horizontal",
          "chart": "bar",
          "counter_pos": "above",
          "spyable": true,
          "queries": {
            "mode": "all",
            "ids": [
              0,
              1,
              2,
              3,
              4,
              5,
              6
            ]
          },
          "tmode": "terms",
          "tstat": "total",
          "valuefield": "",
          "title": "Message Types"
        },
        {
          "error": false,
          "span": 4,
          "editable": true,
          "type": "terms",
          "loadingEditor": false,
          "field": "src_ip",
          "exclude": [],
          "missing": false,
          "other": false,
          "size": 10,
          "order": "count",
          "style": {
            "font-size": "10pt"
          },
          "donut": false,
          "tilt": false,
          "labels": true,
          "arrangement": "horizontal",
          "chart": "bar",
          "counter_pos": "above",
          "spyable": false,
          "queries": {
            "mode": "all",
            "ids": [
              0,
              1,
              2,
              3,
              4,
              5,
              6
            ]
          },
          "tmode": "terms",
          "tstat": "total",
          "valuefield": "",
          "title": "Source IP"
        },
        {
          "error": false,
          "span": 4,
          "editable": true,
          "type": "terms",
          "loadingEditor": false,
          "field": "dst_ip",
          "exclude": [],
          "missing": true,
          "other": true,
          "size": 10,
          "order": "count",
          "style": {
            "font-size": "10pt"
          },
          "donut": false,
          "tilt": false,
          "labels": true,
          "arrangement": "horizontal",
          "chart": "bar",
          "counter_pos": "above",
          "spyable": true,
          "queries": {
            "mode": "all",
            "ids": [
              0,
              1,
              2,
              3,
              4,
              5,
              6
            ]
          },
          "tmode": "terms",
          "tstat": "total",
          "valuefield": "",
          "title": "DESTINATION IP"
        }
      ],
      "notice": false
    },
    {
      "title": "Events",
      "height": "350px",
      "editable": true,
      "collapse": false,
      "collapsable": true,
      "panels": [
        {
          "title": "All events",
          "error": false,
          "span": 12,
          "editable": true,
          "group": [
            "default"
          ],
          "type": "table",
          "size": 100,
          "pages": 5,
          "offset": 0,
          "sort": [
            "timestamp",
            "desc"
          ],
          "style": {
            "font-size": "9pt"
          },
          "overflow": "min-height",
          "fields": [
            "duration",
            "cisco_message",
            "geoip.location",
            "direction",
            "src_ip",
            "dst_ip",
            "timestamp",
            "dst_port",
            "syslog_severity",
            "src_xlated_ip",
            "src_mapped_ip"
          ],
          "localTime": true,
          "timeField": "@timestamp",
          "highlight": [],
          "sortable": true,
          "header": true,
          "paging": true,
          "spyable": true,
          "queries": {
            "mode": "all",
            "ids": [
              0,
              1,
              2,
              3,
              4,
              5,
              6
            ]
          },
          "field_list": true,
          "status": "Stable",
          "trimFactor": 300,
          "normTimes": true,
          "all_fields": false
        }
      ],
      "notice": false
    }
  ],
  "editable": true,
  "failover": false,
  "index": {
    "interval": "day",
    "pattern": "[logstash-]YYYY.MM.DD",
    "default": "NO_TIME_FILTER_OR_INDEX_PATTERN_NOT_MATCHED",
    "warm_fields": true
  },
  "style": "dark",
  "panel_hints": true,
  "pulldowns": [
    {
      "type": "query",
      "collapse": false,
      "notice": false,
      "query": "*",
      "pinned": true,
      "history": [
        "_grok",
        "severity alert",
        "severity critical",
        "severity error",
        "severity warning",
        "severity informational",
        "cisco-fw",
        "severity emergencie",
        "severity emergencies",
        "severity errors"
      ],
      "remember": 10,
      "enable": true
    },
    {
      "type": "filtering",
      "collapse": false,
      "notice": true,
      "enable": true
    }
  ],
  "nav": [
    {
      "type": "timepicker",
      "collapse": false,
      "notice": false,
      "status": "Stable",
      "time_options": [
        "5m",
        "15m",
        "1h",
        "6h",
        "12h",
        "24h",
        "2d",
        "7d",
        "30d"
      ],
      "refresh_intervals": [
        "5s",
        "10s",
        "30s",
        "1m",
        "5m",
        "15m",
        "30m",
        "1h",
        "2h",
        "1d"
      ],
      "timefield": "@timestamp",
      "now": true,
      "filter_id": 0,
      "enable": true
    }
  ],
  "loader": {
    "save_gist": false,
    "save_elasticsearch": true,
    "save_local": true,
    "save_default": true,
    "save_temp": true,
    "save_temp_ttl_enable": true,
    "save_temp_ttl": "30d",
    "load_gist": true,
    "load_elasticsearch": true,
    "load_elasticsearch_size": 20,
    "load_local": true,
    "hide": false
  },
  "refresh": false
}
It would be great if you shared the dashboard code. Thanks in advance.
I just updated the blog post. Code is all the way at the bottom.
Would you be willing to explain your dashboard configuration? It’s quite nice, but I’m having an issue getting it working.
Thanks!
Chris
Thanks for the compliment. Yeah, sure. I just updated the blog post. Code is all the way at the bottom.
I’m using your conf file as part of a existing file I had for collecting windows event logs, ASA are events are coming in, but getting a lot of _grokparsefailure tags and there appears to be no parsing of ip or timestamps. I’m using the flatjar version of logstash on a Linux box. Do I need to be using the full zip version?
Thanks!
Not sure. Were you able to figure this out?
+1 for the _grokparsefailure tags
I think it’s related to not having the CISCO_TAGGED_SYSLOG custom pattern defined in the config or having a reference to a custom pattern file.
Do you mind if I add this dashboard to a repo I’m trying to kickstart for the community? (https://github.com/markwalkom/kibana-dashboards)
Not at all. Go for it!
Is there anyway that I can import ASA logs using this script, I have tried using this method but it doesn’t import anything
I just copied the script and called it ASA.conf ( i changed the pasterns directories to where they are on my machine, but that was it.
./bin/logstash –config ASA.conf :warn}
Using milestone 1 filter plugin ‘syslog_pri’. This plugin should work, but would benefit from use by folks like you. Please let us know if you find bugs or have suggestions on how to improve this plugin. For more information on plugin milestones, see http://logstash.net/docs/1.4.2/plugin-milestones {:level=>:warn}
Using milestone 2 output plugin ‘elasticsearch_http’. This plugin should be stable, but if you see strange behavior, please let us know! For more information on plugin milestones, see http://logstash.net/docs/1.4.2/plugin-milestones {:level=>:warn}
Interrupt received. Shutting down the pipeline. {:level=>:warn}
Of course, if you are talking about a text file with asa syslogs. You can change your input to this…
input {file {
type => “cisco-fw”
path => ...
}
}
and then run logstash.
Jack,
Here is another angle for this great script.
has anyone go an idea of how to import Cicso ASA logs correctly. I have
I have the following in a conf file
input {
stdin {
type => “cisco-fw”
}
}
filter {
grok {
type => “Firewall”
patterns_dir => “/opt/logstash-1.4.2/logstash-1.4.2/patterns/firewalls”
pattern => “%{SYSLOGTIMESTAMP}%{SPACE}%{IP:ciscoip}%{SPACE}%{SYSLOGPROG}:%{SPACE}%{WORD:action}%{DATA:seg1}:%{IPORHOST:seg1ip}/%{NUMBER:seg1port}%{SPACE}%{DATA:seg2}:%{IPORHOST:seg2ip}/%{NUMBER:seg2port}%{SPACE}%{GREEDYDATA:segtail}”
pattern => “%{SYSLOGTIMESTAMP}%{SPACE}%{IPORHOST:ciscoip}%{SPACE}%{SYSLOGPROG}:%{SPACE}%{WORD:action}%}”
pattern => “%{GREEDYDATA}”
add_tag => “tc1-asa”
}
date {
locale => “en”
match => [ “timestamp”, “dd/MMM/yyyy:HH:mm:ss Z” ]
timezone => “Europe/Rome”
}
}
output {
elasticsearch {
cluster => “elasticsearch”
host => “127.0.0.1”
protocol => http
index => “asa-logs”
index_type => “cisco-fw”
}
}
I run the following to import my logs
./bin/logstash –config ASA.conf < /home/local6.log
and i get the below, it's seems to be missing a lot of info.
Field Action Value
@timestamp 2014-07-25T10:24:16.931Z
@version 1
_id xsRqv0X1Qve2TwJEo4EoVA
_index asa-logs
_type cisco-fw
host kibana.domain.local
message Jul 25 00:01:03 server1 %ASA-6-305011: Built dynamic UDP translation from SECURITY_LAN:10.10.10.4/53038 to OUTSIDE:218.23.5.6/56364
type cisco-fw
Can anyone help with this please?
Rob,
do you mind posting a couple lines from your cisco log file (sanitized of any identifiable information of course). I want to see what happens when I try running it. I may be wrong but I believe you have to put the file input on your logstash config file.
input {

    file {

        path => /home/local6.log

        ......

        }

}
Jack,
Thanks for the reply, much appreciated. I have copied a few lines from my ASA logs and posted below.
I have tried the input method as you suggested but it doesn’t actually import anything at all. Using the ASA.conf i posted in my original post works fine but has limited output in kibana.
also posted below.
The out put you are getting is really really good but mine is a million miles away from that.
Sample from ASA logs
***************************************************************
Jul 28 00:00:02 ASA1 %ASA-6-305011: Built dynamic TCP translation from SECURITY_LAN1:183.15.1.10/62153 to OUTSIDE:217.114.172.69/61891
Jul 28 00:00:02 ASA1 %ASA-6-302013: Built outbound TCP connection 1603231744 for OUTSIDE:21.223.10.153/443 (23.253.20.253/443) to SECURITY_LAN1:183.15.1.10/62153 (217.114.172.69/61891)
Jul 28 00:00:02 ASA1 %ASA-6-302015: Built inbound UDP connection 1603231745 for DMZ1:10.67.1.111/34930 (10.6.11.211/34930) to SECURITY_LAN:162.21.2.35/53 (171.11.1.18/53)
Jul 28 00:00:02 ASA1 %ASA-6-302014: Teardown TCP connection 1603231685 for DMZ1:10.67.1.111/22 to SECURE_LAN:171.11.1.44/35836 duration 0:00:00 bytes 95296 TCP FINs
Jul 28 00:00:02 ASA1 %ASA-6-302015: Built inbound UDP connection 1603231746 for DMZ1:10.67.1.111/34696 (10.6.11.211/34696) to SECURITY_LAN:162.21.2.35/53 (171.11.1.18/53)
Jul 28 00:00:02 ASA1 %ASA-6-302016: Teardown UDP connection 1603231743 for DMZ1:10.67.1.111/58658 to SECURITY_LAN:162.21.2.35/53 duration 0:00:00 bytes 132
Jul 28 00:00:02 ASA1 %ASA-6-302016: Teardown UDP connection 1603231745 for DMZ1:10.67.1.111/34930 to SECURITY_LAN:162.21.2.35/53 duration 0:00:00 bytes 170
Jul 28 00:00:02 ASA1 %ASA-6-302015: Built inbound UDP connection 1603231747 for DMZ1:10.67.1.111/46799 (10.6.11.211/46799) to SECURITY_LAN:162.21.2.35/53 (171.11.1.18/53)
Jul 28 00:00:02 ASA1 %ASA-6-302016: Teardown UDP connection 1603231746 for DMZ1:10.67.1.111/34696 to SECURITY_LAN:162.21.2.35/53 duration 0:00:00 bytes 94
Jul 28 00:00:02 ASA1 %ASA-6-302015: Built inbound UDP connection 1603231748 for DMZ1:10.67.1.111/58232 (10.6.11.211/58232) to SECURITY_LAN:162.21.2.35/53 (171.11.1.18/53)
Jul 28 00:00:02 ASA1 %ASA-6-302016: Teardown UDP connection 1603231747 for DMZ1:10.67.1.111/46799 to SECURITY_LAN:162.21.2.35/53 duration 0:00:00 bytes 132
Jul 28 00:00:02 ASA1 %ASA-6-302015: Built inbound UDP connection 1603231749 for DMZ1:10.67.1.111/50445 (10.6.11.211/50445) to SECURITY_LAN:162.21.2.35/53 (171.11.1.18/53)
Jul 28 00:00:02 ASA1 %ASA-6-302016: Teardown UDP connection 1603231748 for DMZ1:10.67.1.111/58232 to SECURITY_LAN:162.21.2.35/53 duration 0:00:00 bytes 170
Jul 28 00:00:02 ASA1 %ASA-6-302016: Teardown UDP connection 1603231749 for DMZ1:10.67.1.111/50445 to SECURITY_LAN:162.21.2.35/53 duration 0:00:00 bytes 94
Jul 28 00:00:02 ASA1 %ASA-6-302013: Built inbound TCP connection 1603231750 for OUTSIDE:207.126.144.188/48354 (207.126.144.188/48354) to SECURE_LAN:171.11.1.59/25 (217.114.172.68/25)
Jul 28 00:00:02 ASA1 %ASA-6-302013: Built outbound TCP connection 1603231751 for DMZ1:12.2.1.114/22 (12.67.1.115/22) to SECURE_LAN:171.11.1.44/32773 (171.11.1.44/32773)
Jul 28 00:00:02 ASA1 %ASA-6-302014: Teardown TCP connection 1603231742 for OUTSIDE:157.55.235.58/65006 to DMZ:10.6.11.206/80 duration 0:00:00 bytes 1975 TCP FINs
Jul 28 00:00:02 ASA1 %ASA-7-609002: Teardown local-host OUTSIDE:157.55.235.58 duration 0:00:00
Jul 28 00:00:02 ASA1 %ASA-6-302015: Built inbound UDP connection 1603231752 for DMZ1:12.2.1.114/33358 (12.67.1.115/33358) to SECURE_LAN:171.11.1.17/53 (171.11.1.17/53)
Jul 28 00:00:02 ASA1 %ASA-6-302015: Built inbound UDP connection 1603231753 for DMZ1:12.2.1.114/60120 (12.67.1.115/60120) to SECURE_LAN:171.11.1.17/53 (171.11.1.17/53)
Jul 28 00:00:02 ASA1 %ASA-6-302016: Teardown UDP connection 1603231752 for DMZ1:12.2.1.114/33358 to SECURE_LAN:171.11.1.17/53 duration 0:00:00 bytes 118
Jul 28 00:00:02 ASA1 %ASA-6-302016: Teardown UDP connection 1603231753 for DMZ1:12.2.1.114/60120 to SECURE_LAN:171.11.1.17/53 duration 0:00:00 bytes 92
Jul 28 00:00:02 ASA1 %ASA-7-106100: access-list DMZ permitted udp DMZ/10.6.11.214(123) -> OUTSIDE/54.246.100.200(123) hit-cnt 1 first hit [0xf69bd6ce, 0x0]
*****************************************************************
Kibana output
Field Action Value
@timestamp 2014-07-28T08:04:50.148Z
@version 1
_id elEloz5NTaaw_jbbqkgr3A
_index my-logs
_type Cisco-fw
host logstest.domain.local
message Jul 28 00:00:02 ASA1 %ASA-6-302015: Built inbound UDP connection 1603231765 for DMZ1:12.2.1.114/58675 (12.67.1.115/58675) to SECURE_LAN:171.11.1.17/53 (171.11.1.17/53)
type cisco-fw
****************************************************************
Ahhhh now I see what is wrong. The formatting of the cisco logs in your log file is not correct.
For example…
Jul 28 00:00:02 ASA1 %ASA-6-302015: Built inbound UDP connection 1603231749 for DMZ1:10.67.1.111/50445 (10.6.11.211/50445) to SECURITY_LAN:162.21.2.35/53 (171.11.1.18/53)
as you already know returns this…
{"message":"Jul 28 00:00:02 ASA1 %ASA-6-302015: Built inbound UDP connection 1603231749 for DMZ1:10.67.1.111/50445 (10.6.11.211/50445) to SECURITY_LAN:162.21.2.35/53 (171.11.1.18/53)","@version":"1",
"@timestamp":"2014-07-28T17:59:16.011Z",
"host":"10.0.5.72:65186",
"type":"cisco-fw",
"tags":["_grokparsefailure"],
"syslog_severity_code":5,
"syslog_facility_code":1,
"syslog_facility":"user-level",
"syslog_severity":"notice",
"geoip":{}}
Modifying the line from this
Jul 28 00:00:02 ASA1 %ASA-6-302015: Built inbound UDP connection 1603231749 for DMZ1:10.67.1.111/50445 (10.6.11.211/50445) to SECURITY_LAN:162.21.2.35/53 (171.11.1.18/53)into this…
<182>Jul 28 00:00:02: %ASA-6-302015: Built inbound UDP connection 1603231749 for DMZ1:10.67.1.111/50445 (10.6.11.211/50445) to SECURITY_LAN:162.21.2.35/53 (171.11.1.18/53)results in this…
{"message":"<182>Jul 28 00:00:02: %ASA-6-302015: Built inbound UDP connection 1603231749 for DMZ1:10.67.1.111/50445 (10.6.11.211/50445) to SECURITY_LAN:162.21.2.35/53 (171.11.1.18/53)","@version":"1",
"@timestamp":"2014-07-28T04:00:02.000Z",
"host":"10.0.5.72:65209",
"type":"cisco-fw",
"syslog_pri":"182",
"timestamp":"Jul 28 00:00:02",
"ciscotag":"ASA-6-302015",
"cisco_message":"Built inbound UDP connection 1603231749 for DMZ1:10.67.1.111/50445 (10.6.11.211/50445) to SECURITY_LAN:162.21.2.35/53 (171.11.1.18/53)",
"syslog_severity_code":6,
"syslog_facility_code":22,
"syslog_facility":"local6",
"syslog_severity":"informational",
"action":"Built",
"direction":"inbound",
"protocol":"UDP",
"connection_id":"1603231749",
"src_interface":"DMZ1",
"src_ip":"10.67.1.111",
"src_port":"50445",
"src_mapped_ip":"10.6.11.211",
"src_mapped_port":"50445",
"dst_interface":"SECURITY_LAN",
"dst_ip":"162.21.2.35",
"dst_port":"53",
"dst_mapped_ip":"171.11.1.18",
"dst_mapped_port":"53",
"geoip":{}}
Here is what is wrong with your the format of your log file (I’m guessing you customized the output in the ASA) and why the patterns are not working.
1. You are missing the syslog severity and log level at the beginning of your log. Ex: “Jul 28” -> “<182>Jul 28…” You can see what those number mean here
2. You need to add a colon after the data of the log. Ex: “Jul 28 00:00:02” -> “Jul 28 00:00:02:”
3. You need to remove ASA1 from the log. Ex: “Jul 28 00:00:02 ASA1 %ASA-6-302013” -> “Jul 28 00:00:02: %ASA-6-302013”
After that you do all that to your logs, you will have usable data in Kibana. Let me know if you need help
Jack,
That is fantastic. I will get this changed today hopefully and I will let you know.
Thanks a million.
Rob
Jack,
Just noticed that you mentioned that I get the following output
***************************************************************************
{“message”:”Jul 28 00:00:02 ASA1 %ASA-6-302015: Built inbound UDP connection 1603231749 for DMZ1:10.67.1.111/50445 (10.6.11.211/50445) to SECURITY_LAN:162.21.2.35/53 (171.11.1.18/53)”,
“@version”:”1″,
“@timestamp”:”2014-07-28T17:59:16.011Z”,
“host”:”10.0.5.72:65186″,
“type”:”cisco-fw”,
“tags”:[“_grokparsefailure”],
“syslog_severity_code”:5,
“syslog_facility_code”:1,
“syslog_facility”:”user-level”,
“syslog_severity”:”notice”,
“geoip”:{}}
******************************************************************************
Actually in kibana all i get is this
*********************************************************************
Field Action Value
@timestamp 2014-07-29T10:26:52.825Z
@version 1
_id 0rzj-AphTDS-rFgLN4DURQ
_index my-logs
_type Cisco-fw
host logstest.domain.local
message Jul 28 00:00:02: %ASA-6-302015: Built inbound UDP connection 1603231749 for DMZ1:10.67.1.111/50445 (10.6.11.211/50445) to SECURITY_LAN:162.21.2.35/53 (171.11.1.18/53)
type cisco-fw
************************************************************************************
Right. I guess it gets formatted differently when it is thrown into elasticsearch but I got that output directly from logstash with the
stdout {

	codec => json

}
output.
Jack,
Here is the config I am using again. maybe it’s some errors in it.
*********************************************************************************************
input {
stdin {
type => “cisco-fw”
}
}
filter {
grok {
type => “Firewall”
patterns_dir => “/opt/logstash-1.4.2/logstash-1.4.2/patterns/firewalls”
pattern => “%{SYSLOGTIMESTAMP}%{SPACE}%{IP:ciscoip}%{SPACE}%{SYSLOGPROG}:%{SPACE}%{WORD:action}%{DATA:seg1}:%{IPORHOST:seg1ip}/%{NUMBER:seg1port}%{SPACE}%{DATA:seg2}:%{IPORHOST:seg2ip}/%{NUMBER:seg2port}%{SPACE}%{GREEDYDATA:segtail}”
pattern => “%{SYSLOGTIMESTAMP}%{SPACE}%{IPORHOST:ciscoip}%{SPACE}%{SYSLOGPROG}:%{SPACE}%{WORD:action}%}”
pattern => “%{GREEDYDATA}”
add_tag => “ASA1”
}
date {
locale => “en”
match => [ “timestamp”, “dd/MMM/yyyy:HH:mm:ss Z” ]
timezone => “Europe/Rome”
}
}
output {
elasticsearch {
cluster => “elasticsearch.local”
host => “127.0.0.1”
protocol => http
index => “my-logs”
index_type => “Cisco-fw”
}
}
Looks like you didn’t use my logstash config file from above. It is under Logstash Configuration above. Compare that to yours to get the output I did from your cisco log files.
Jack,
Thanks for the reply
I have tried your script but it doesn’t import anything into kibana.
I have copied the entire conf file and only modified the elasticsearch server (which is the same as the kibana one and also the location of the GeopIP.
I have also copied the kibana dash board config and loaded it up it loads all the dashboard but I get the following
“No results There were no results because no indices were found that match your selected time span” I imported the small amount of ASA logs i posted earlier but they don’t show up.
Jack,
The command I am runing against your config is
./bin/logstash –config ASA.conf < /home//local6.log
Does it have to run against the agent command?
Jack,
I tried it with the following command and still nothing.
java -jar logstash-1.2.2-flatjar.jar agent -f ASA.conf
add this line to the output part of your agent config
stdout { codec => json }This will show the output inside the console window. This will help determine if the issue is with logstash or with kibana. I think this might be an issue with how you are setting to read the file. What I do when I need to index old log files is I will display the file inside a console window and pipe it to the logstash processes TCP port using netcat. Ex:
tail -n1000000 logs/log | nc localhost 3333Jack,
Thanks for that but it only outputs in the shell and not into kibana /logstash
The conf file is. below (By they way i have one one server. All the logs are also on the server and it’s also my syslog server, so I have all the logs locally, so it should be a lot simpler to get my logs into kibana , not so it seems.
input {
stdin {
type => “apache”
}
}
filter {
grok {
match=> { message => “%{COMBINEDAPACHELOG}” }
}
date {
locale => “en”
match => [ “timestamp”, “dd/MMM/yyyy:HH:mm:ss Z” ]
timezone => “Europe/Rome”
}
}
output {
stdout {
codec => json
}
elasticsearch {
cluster => “elasticsearch.local”
host => “127.0.0.1”
protocol => http
index => “my-logs”
index_type => “apache”
}
}
I went through my blog post with a fresh VM to figure out what is going wrong and I realized that I forgot to include the elasticsearch setup instructions. Sorry about that. I have since updated my blog post but I’ll just write what you need to do here so you don’t have to scroll to find it.
Run these commands on your machine running elasticsearch. This will configure elasticsearch.
sudo sed -i -e 's|# cluster.name: elasticsearch|cluster.name: kibana|' /etc/elasticsearch/elasticsearch.ymlNext tell your machine to run elasticsearch on boot.
sudo update-rc.d elasticsearch defaults 95 10sudo service elasticsearch restart
Now try running logstash and see if data is showing up in kibana.
I have done according to the steps, but appear error
Oops! SearchParseException[[logstash-2014.08.06][0]: query[filtered((_all:cisco _all:fw) (_all:severity _all:informational) (_all:severity _all:warning) (_all:severity _all:error) (_all:severity _all:critical) (_all:severity _all:alert) _all:_grok)->BooleanFilter(+no_cache(@timestamp:[1407282918259 TO 1407304518259]))],from[-1],size[500]: Parse Failure [No mapping found for [timestamp] in order to sort on]]
Where do you see this error? I just went through all of the steps and did not get this error. Also, what OS are you running this on?
I get this error too when loading the dashboard. my json output in stdout is missing quite a bit, but I’ve got the severity tags…
“message” => “Nov 03 2014 16:49:21 my-asa : %ASA-6-302013: Built outbound TCP connection 1121863042 for outside:x.x.x.x/389 (x.x.x.x/389) to inside_transit:x.x.x.x/56659 (x.x.x.x/56659)\n”,
“@version” => “1”,
“@timestamp” => “2014-11-03T23:49:21.997Z”,
“type” => “cisco-fw”,
“host” => “x.x.x.x”,
“tags” => [
[0] “_grokparsefailure”
],
“syslog_severity_code” => 5,
“syslog_facility_code” => 1,
“syslog_facility” => “user-level”,
“syslog_severity” => “notice”,
“geoip” => {}
}
Swizzley,
I know exactly what the problem is. It has to do with the formatting of your message which is why you are getting the _grokparsefailure tags.
Your message is missing the facility/severity tag at the beginning of the message. Ex: all of my ASA-6-302013 messages begin with “<182>” which means it is a local6 informational syslog and then followed by the date. Here’s a table of all the facility/severity codes http://i.imgur.com/XIiJcYT.png
Your messages just start with just the date and the grok patterns are not matching against your message. Here is a sanitized version of what a 302013 should look like in order to be matched by the grok patterns
<182>Nov 04 2014 10:53:08: %ASA-6-302013: Built outbound TCP connection 30794389 for outside:x.x.x.x/389 (x.x.x.x/389) to inside_transit:x.x.x.x/56659 (x.x.x.x/56659)\n
How are you running your syslogs through logstash? Are you sending them directly from the ASA like I did with my directions above or are you importing from a file?
I got it working, and your dash works like a charm. It actually wasn’t just the severity tag at the beginning. At first I was grabbing them from rsyslog which didn’t have the severity tag. Once I piped them strait over UDP to logstash I was getting the tag, but it took the rest of the day to find that the patterns file was real problem. CISCO_TAGGED_SYSLOG has a var in there for sysloghost, and for some reason that var was keeping grok from picking up the line properly. So I replaced the var in the patterns file with the actual string of the mysyslog host in my output and BANG! Magic, it started working. I’m guessing that var is for sending multiple ASAs to the same input, which at the moment I only have one, and if I do more in the future I’ll use a different port and a different pattern for CISCO_TAGGED_SYSLOG_new or something because that was a nightmare! Thanks for the great work, my graphs look amazing. I did some tweaking, and wish you didn’t use bettermap, but overall very impressive. Thanks again!
Thanks for nice step by step guide.
Please also do the same for cisco ASA netflow analysis using Logstash, Elasticsearch and Kibana (ELK).
We need also CISCO ASA netflow collection step by step guide using ELK.
Please help us in this regards.
We highly need this using open source product like ELK
Thanks in advance.
Can you send me some Cisco netflow data so I can take a look to see what I need to do?
You can check the below link as a reference regarding netflow :
http://www.bulutsal.com/2014/03/netflow-analysis-using-elasticsearch.html
I am confused :
How to dump netflow data from firewall to create dump files:step1
Hopefully u will prepare a new step by step tutorial for netflow anaysis using ELK.
Thanks in advance
ASA firewalls are capable of generating Netflow however currently there is no way to get Netflow data direcly inserted into ES. You have to massage data using techniques I’ve explained in my blog (bulutsal.com) and use Kibana to analyze it.
I’m prepping another blog post combining L7 data (HTTP, SMTP, DNS etc) along with NetFlow v5 fields soon. There are bunch of tutorials around to get NetFlow set up, but if you still need help please ping me on my blog.
Can Kibana have a front end logon on page?
We need to do this as audti findings require us secure log and stats from non IT personal.
Any help would be great…
Nice demo…
Not out of the box. There are guides on how to do this online, though. Someone made a authentication proxy for kibana, which you can find here https://github.com/fangli/kibana-authentication-proxy but I cannot speak for how well it works because I have never used it.
Hello Jack
Nice demo:) Can you tell my how can I customize grok for this output:
%ASA-6-302016: Teardown UDP connection 1002776 for outside:x.x.x.x./53 to inside:x.x.x.x/44669 duration 0:00:00 bytes 160
I tried to change CISCO_TAGGED_SYSLOG in /opt/logstash/patterns/firewalls buy without success
It looks :
CISCO_TAGGED_SYSLOG ^%{CISCOTIMESTAMP:timestamp}( %{SYSLOGHOST:sysloghost})?: %%{CISCOTAG:ciscotag}:
my grok:
match => [“message”, “%{CISCO_TAGGED_SYSLOG} %{GREEDYDATA:cisco_message}”]
Thanx
I am confused. ASA-6-302016 exists as a patern built into logstash. Are you getting grok_parsefailure messages for those messages? What exactly are you trying to do? This is what I get…
{"_index": "logstash-2014.12.01",
"_type": "cisco-fw",
"_id": "RXaL_q21R2-N_qP2syG7wA",
"_score": null,
"_source": {
"message": "<182>Dec 01 2014 12:38:13: %ASA-6-302016: Teardown UDP connection 35930000 for outside:192.168.1.2/137 to inside:10.0.0.5/137 duration 0:02:04 bytes 150\n",
"@version": "1",
"@timestamp": "2014-12-01T17:38:13.000Z",
"type": "cisco-fw",
"host": "10.0.0.1",
"syslog_pri": "182",
"timestamp": "Dec 01 2014 12:38:13",
"ciscotag": "ASA-6-302016",
"cisco_message": "Teardown UDP connection 35930000 for outside:192.168.1.2/137 to inside:10.0.0.5/137 duration 0:02:04 bytes 150",
"syslog_severity_code": 6,
"syslog_facility_code": 22,
"syslog_facility": "local6",
"syslog_severity": "informational",
"action": "Teardown",
"protocol": "UDP",
"connection_id": "35930000",
"src_interface": "outside",
"src_ip": "192.168.1.2",
"src_port": "137",
"dst_interface": "inside",
"dst_ip": "10.0.0.5",
"dst_port": "137",
"duration": "0:02:04",
"bytes": 150,
"geoip": {}
},
"sort": [
"dec",
1417455493000
]
}
output: %ASA-6-302016: Teardown UDP connection 1002776 for outside:x.x.x.x/53 to inside:x.x.x.x./44669 duration 0:00:00 bytes 160
output is with 158 code. Cant put it in comment
Was hoping for some feedback please.
Only the ‘Message Types’ shows correctly in Kibana, everything else is empty. Wondering if my Syslog messages are formatted correctly, coming from the ASA? The example you gave above, shows the Device Id first. With our setup, it shows the Timestamp first, then the Device Id. Also, my Device Id shows as “ASA”, and not “” :
Dec 19 2014 21:00:40 ASA : %ASA-6-302015: Built inbound UDP connection 1897817 for inside:10.1.1.100/59521 (10.1.1.100/59521) to outside:192.168.1.100/53 (192.168.1.100/53)
Do I need to make a change on the ASA Syslog settings, the conf file, or Kibana template? I’ve tinkered with the ASA Syslog settings, removing the Timestamp, and using Emblem format, but nothing seems to change.
Thank you.
A couple of people have been having this issue as well. You’re definitely right in that it has to do with your syslog formatting.
You are missing the severity and log level at the beginning of your log. Ex: “Dec 19…” should be “<182>Dec 19…” You can see what those numbers mean here.
Also, having “ASA” after the timestamp is perfectly acceptable but it has to end with a colon (unlike yours which ends with a space and then a colon). How are you shipping the syslogs to Logstash? Is it directly coming from the ASA to logstash like I have in this tutorial over UDP?
Now I am using straight UDP. But in Kibana, the Source IP section is blank, and the Destination IP section has thousands of ” Missing field” hits. Also, tags has ‘_grokparsefailure’ in it. Sure, this seems like a parsing problem, but I have no idea what to change in the patterns file. Thank you.
I use UDP for my configuration and it works fine for me. What version of the ASA are you running? Add this to the end of your logstash config file inside output
stdout {codec => json
}
Then run logstash, pipe those syslog messages to it again and then send me the raw output from the command line/terminal. I want to see what is set for message and then I can run that against a grok debugger and see why it is not working for you.
Our ASA is current, v 9.22-4 .
Yes, we have the codec statement at the bottom.
Thank you.
“Jan 12 2015 19:01:40 ASA-X5545 : %ASA-6-302015: Built outbound UDP connection 261946162 for inside:192.168.x.y/53 (192.168.x.y/53) to outside:192.168.a.b/51762 (192.168.a.b/51762)\n”,”@version”:”1″,”@timestamp”:”2015-01-12T19:01:40.415Z”,”type”:”cisco-fw”,”host”:”10.x.y.z”,”tags”:[“_grokparsefailure”],”syslog_severity_code”:5,”syslog_facility_code”:1,”syslog_facility”:”user-level”,”syslog_severity”:”notice”,”geoip”:{}}{“message”:”Jan 12 2015 19:01:40 ASA-X5545 : %ASA-6-302016: Teardown UDP connection 261946162 for inside:192.168.x.y/53 to outside:192.168.a.b/51762 duration 0:00:00 bytes 70\n”,”@version”:”1″,”@timestamp”:”2015-01-12T19:01:40.415Z”,”type”:”cisco-fw”,”host”:”10.x.y.z”,”tags”:[“_grokparsefailure”],”syslog_severity_code”:5,”syslog_facility_code”:1,”syslog_facility”:”user-level”,”syslog_severity”:”notice”,”geoip”:{}}{“message”:”Jan 12 2015 19:01:40 ASA-X5545 : %ASA-4-106023: Deny udp src outside:192.168.x.y/35737 dst outside:193.0.e.f/53 by access-group \”outside\” [0x0, 0x0]\n”,
I see. You, as well as a decent amount of others in the comments, have a formatting problem in your syslog message.
What is happening is that You are missing the severity and log level at the beginning of your log. Ex: “Jan 12 2015” should be “<182>Jan 12 2015…” You can see what those numbers mean here. The severity level should be sending over if you are using UDP from your ASA. Are you sure you are using UDP?
Also, you have your hostname of the ASA being sent to logstash (ASA-X5545). See what this user did to fix that issue here which involves changing the CISCO_TAGGED_SYSLOG definition in you pattern file.
Let me know if you need any help!
I finally was able to use your dashboard after few changes.
For anyone interested:
1. in the ASA configuration, add the timestamp. logging timestamp
2. in the C:\logstash-1.4.2\patterns\firewalls, changed the CISCO_TAGGED_LOG to
CISCO_TAGGED_SYSLOG ^%{CISCOTIMESTAMP:timestamp} ASA5540 ?: %%{CISCOTAG:ciscotag}:
there should be a way to keep the sysloghost variable, but at least it’s working now
Kibana 4, is now out, do you know if your dashboard is compatible with it ?
Thanks for your input,
Yohan
I am also interested how to get this on kibana 4.
Yes, to get this in Kibana 4 would be great, I have been trying to XPUT is into kibana-int with no luck
Hi Jack,
Thanks for this nice article.
Do you notice that Cisco ASA’s Session Teardown doesn’t include the traffic direction field, so the the IP address after the “for” may NOT be the source IP.
For example “%ASA-session-6-302014: Teardown TCP connection 647415652 for outside:216.58.220.130/80 to dmz:10.111.222.33/58443 duration 0:00:15 bytes 28934 TCP FINs”, the IP 216.58.220.130 is a destination host!
Any thought on this?
Thanks
Hi Jack,
Its excellent article i have followed your article,but i have two tags one is GeoIp TAG ,which parses correctly and able to view all the fields in the kibana 4.3 ,but i do have another tag which is “_grokparsefailure” which has logs which was not parsed correctly,but i have 90% logs under this _grokparsefailure ,only 10% is parsing correctly which has GeoIp TAG. Please let me know your valuable suggestion,which would be very useful for me.
Thank you in advance
Can you send me a few examples of your raw messages? They are listed on the message portion of the result. Sanitize it of course by changing the IP addresses
will these steps works with cisco routers as well?
Hey Jack – thanks for an excellent guide
I realize it is a couple of years old, but all I had to tweak to get this running was to use the version 2 og GeoLite db (http://geolite.maxmind.com/download/geoip/database/GeoLite2-City.tar.gz), and put the geoip stuff in a “if [src_ip] {}” so it would only try to lookup on events that actually had a source ip to look up.
My only problem now, is that I cannot import the dashboard, because I use a much newer version of Kibana, than you did back when writing this – I will go looking for another alternative, but I just wanted to praise you for taking the time and effort to put this online – so thanks! 🙂